Fuel used in the transport sector in different countries
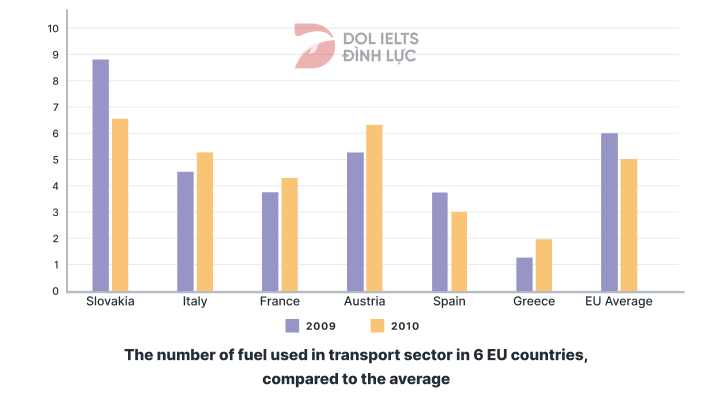
Đề thi IELTS Writing Task 1 ngày 27/04/2019 dạng Bar chart: The chart below shows information about fuel used in the transport sector in different countries in Europe, compared to the EU average, in 2009 and 2010. Ở bài viết này DOL sẽ viết 1 sample IELTS Writing được 8.0 kèm với 1 số từ vựng và cấu trúc hay trong bài. Chúc các bạn học IELTS vui vẻ cùng dol.vn.

🚀 Đề bài
😵 Dàn ý
DOL sẽ miêu tả biểu đồ với 1 câu mở bài (Intro), 1 đoạn miêu tả tổng quát (Overview), và 2 đoạn thân bài miêu tả chi tiết (Detailed Description)
Mở bài: DOL sẽ paraphrase lại đề bài để giới thiệu lại đề bài cho người chấm
Miêu tả tổng quát: DOL sẽ chỉ ra các đặc điểm quan trọng, nổi bật nhất trong biểu đồ
Thân bài: Vì đây là dạng bài có số liệu thay đổi qua nhiều mốc thời gian, ta sẽ tập trung vào xu hướng tăng giảm của các số liệu
Body 1: Đầu tiên, DOL sẽ đưa ra những mốc số liệu bắt đầu và kết thúc của các hạng mục.
Body 2: Tiếp đến, DOL sẽ đi vào chi tiết hơn - so sánh cụ thể xu hướng, những thay đổi giữa các hạng mục đó.
- Slovakia: 9% - higher than the figure for EU Average
- Austria ranked second
- France and Spain only spent less than 4%
- Greece spent at just over 1%
- To 6.5%, 3% and 5%, respectively
- To 5.2%, 4.2% and 2%, respectively
📝 Bài mẫu
The bar chart delineates the data on
Looking at the graph from a general perspective, it can be seen that Slovakia consumed fuels the most for
In 2009, nearly 9% of total fuel consumption was used for transportation in Slovakia,
2010
(183 words)
📚 Vocabulary
List vocab bổ ích trong bài Sample IELTS Writing vừa rồi.


✨ Bài tập Exercise
Mình cùng làm bài tập sau đây để ôn lại các từ vựng và cấu trúc đã được dùng trong bài mẫu IELTS Writing Task 1 nhé!
1 Biểu đồ cột cho thấy thông tin về việc tiêu thụ nhiên liệu trong ngành vận tải ở 6 quốc gia châu Âu khác nhau.
=> The bar chart delineates the data on
2 So với số người tham gia của năm ngoái thì năm nay thấp hơn rất nhiều.
=> The number of participants are much lower,
3 Lượng nhiên liệu tiêu thụ ở Việt Nam giảm 10%.
=> Vietnam
4 Số lượng khẩu trang được sản xuất năm nay thì cao gấp 2 lần số lượng sản xuất năm ngoái.
=> The number of masks produced this year
5 Anh ấy xếp thứ 2 trong cuộc đua.
=> He
6 Tỷ lệ nhập khẩu vào Mỹ cao hơn 3% so với EU.
=> The import rate in the US
Bài mẫu chọn lọc tháng 4/2019 dành cho mục tiêu 7.0+
💡 Lời kết
Tới đây là hết rồi  Sau sample "The chart below shows information about fuel used in the transport sector in different countries in Europe, compared to the EU average, in 2009 and 2010" vừa rồi, DOL mong các bạn không chỉ nắm được cách trả lời cho dạng bài Bar chart, mà còn học được những từ vựng và cấu trúc hay để miêu tả các biểu đồ tương tự nhé.
Nếu có thời gian thì nhớ làm phần bài tập và tự mình viết một bài khác nha vì 'Practice makes perfect' mà nhỉ? DOL chúc các bạn học tốt! 
Bài viết khác
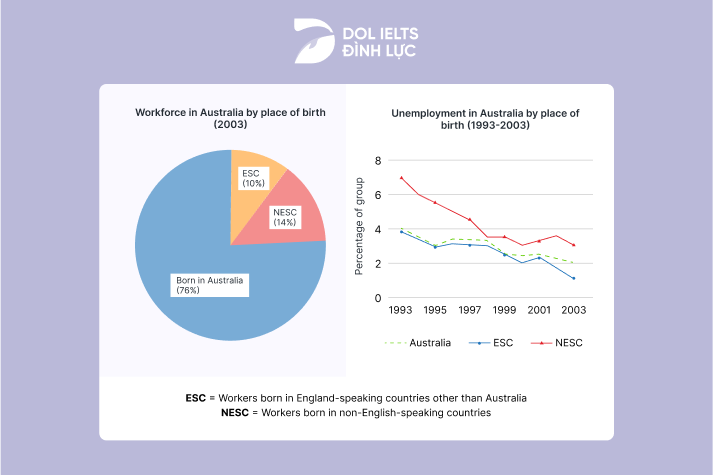
Đề thi IELTS Writing Task 1 ngày 17/02/2024 dạng Mixed Charts: The chart and graph below give information about three categories of workers in Australia and the unemployment levels within those groups. Summarise the information by selecting and reporting the main features, and make comparisons where relevant.
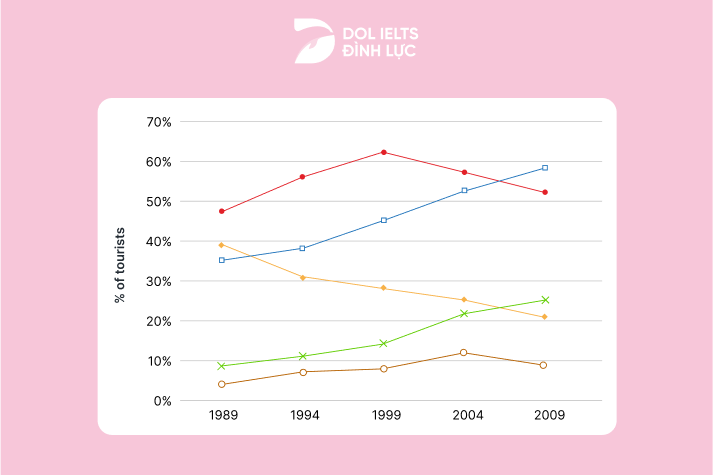
Đề thi IELTS Writing Task 1 ngày 03/02/2024 dạng Line graph: The graph below shows the percentage of Australian export to four countries from 1990 to 2012. Summarise the information by selecting and reporting the main features, and make comparisons where relevant.
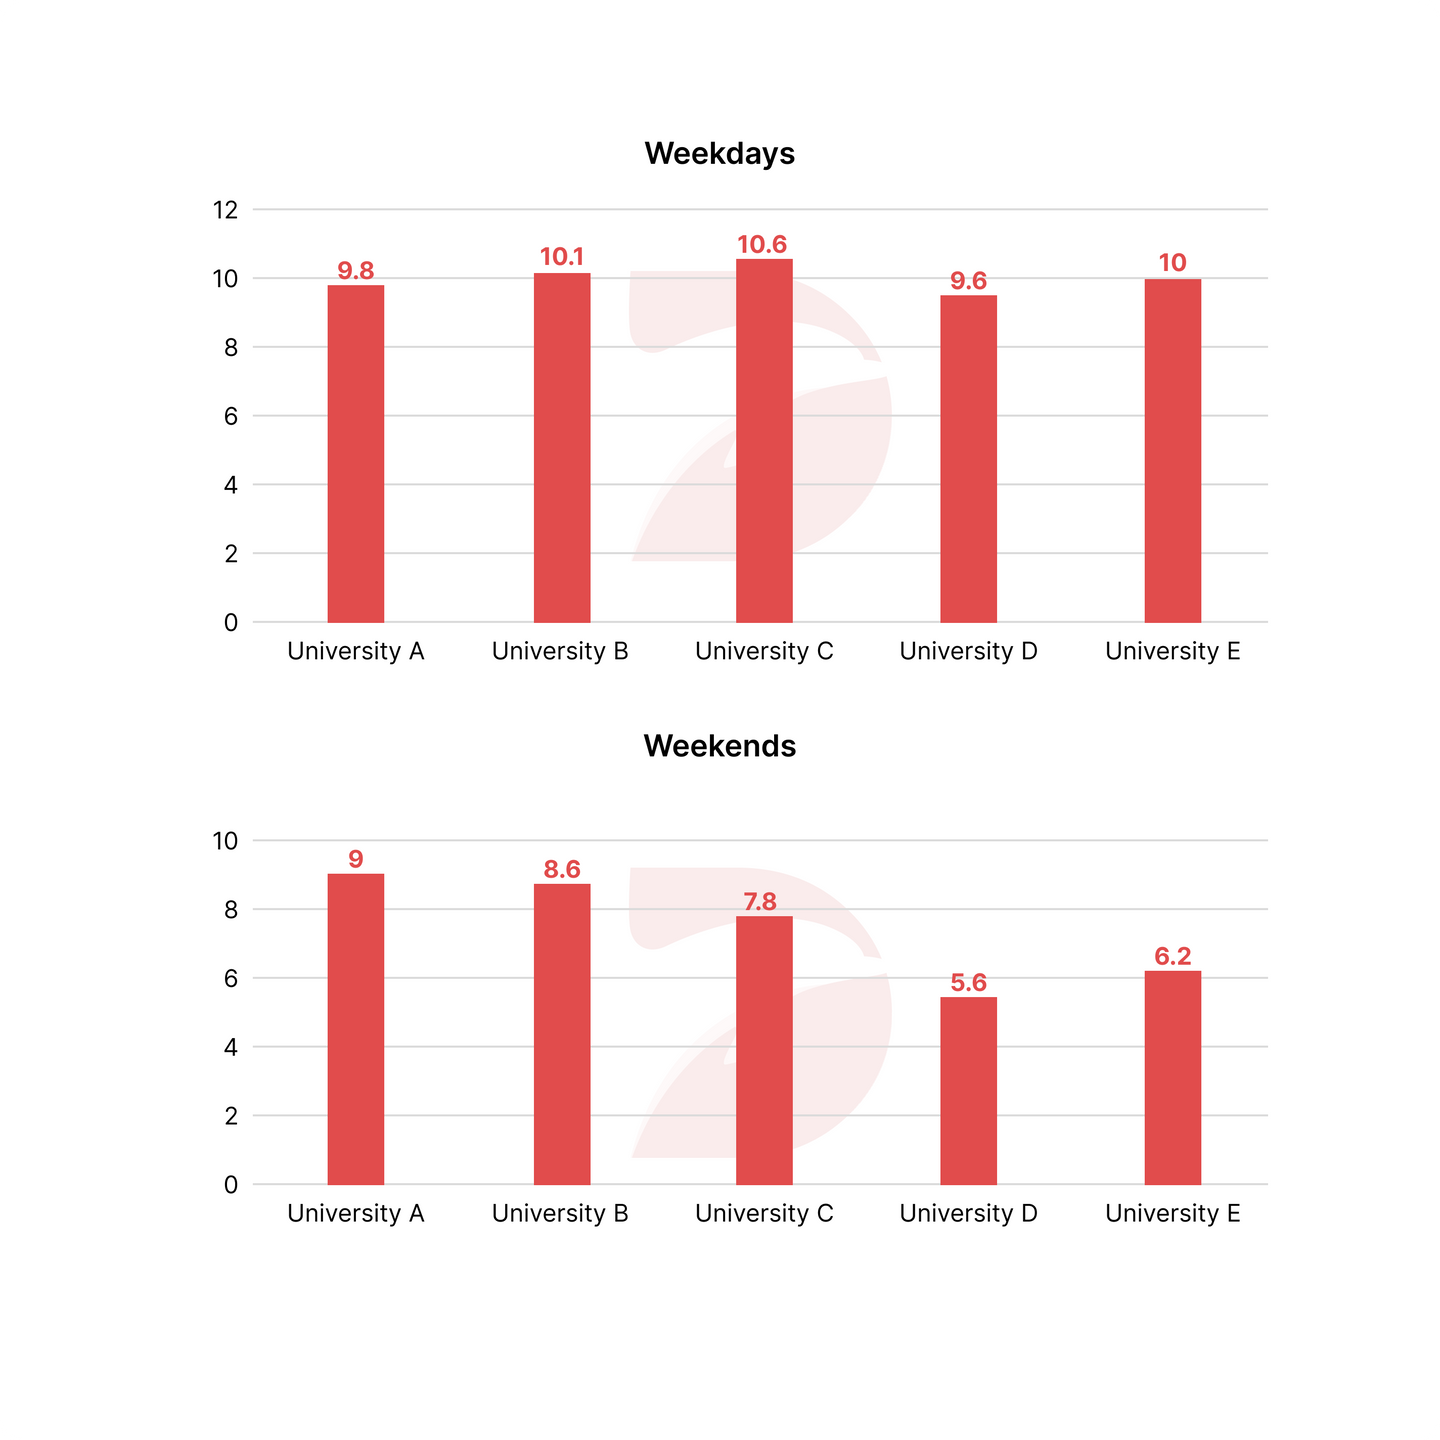
Đề thi IELTS Writing Task 1 ngày 18/04/2024 dạng Bar chart: The bar chart shows the average number of hours students in five different universities studied.
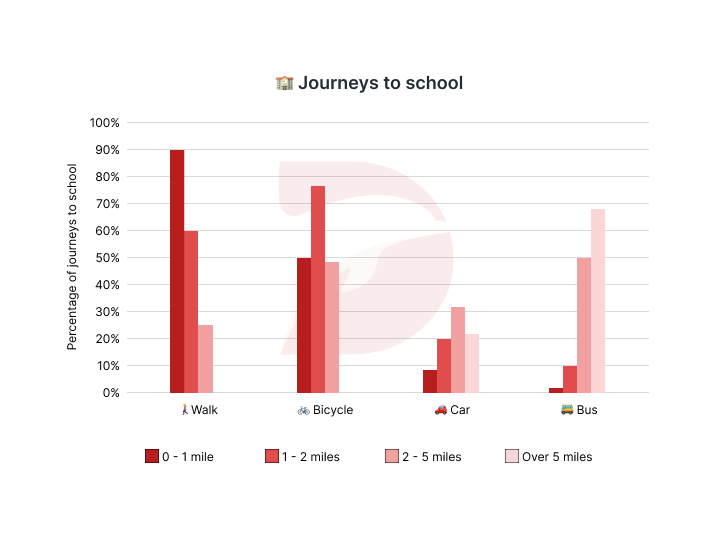
Đề thi IELTS Writing Task 1 ngày 13/04/2024 dạng Bar chart: The chart below gives information about the journeys to school by children aged 11 to 16 in the UK in a year. Summarise the information by selecting and reporting the main features, and make comparisons where relevant.
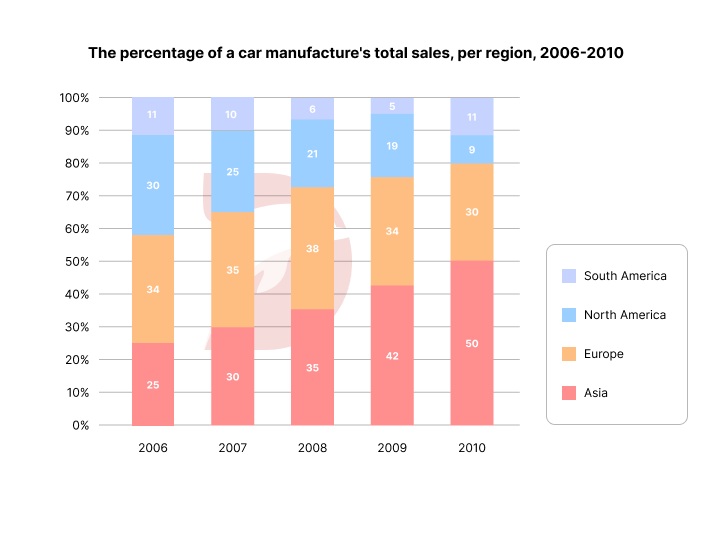
Đề thi IELTS Writing Task 1 ngày 16/03/2024 dạng Bar chart: The chart below shows the percentage of a car manufacturer’s total sales in various regions from 2006 to 2010. Summarise the information by selecting and reporting the main features, and make comparisons where relevant.