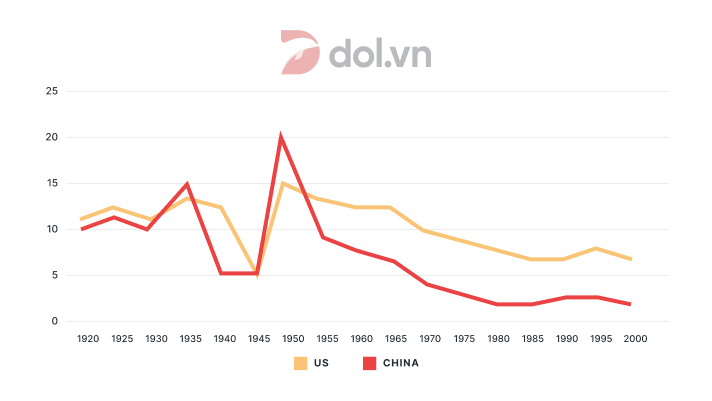
Compares changes in the birth rates of China and the USA between 1920 – 2000
Đề thi IELTS Writing Task 1 ngày 20/11/2021: The graph below compares changes in the birth rates of China and the USA between 1920 – 2000.

🚀 Đề bài
😵 Dàn ý
DOL sẽ miêu tả biểu đồ với 1 câu mở bài (Intro), 1 đoạn miêu tả tổng quát (Overview), và 2 đoạn thân bài miêu tả chi tiết (Detailed Description)
Mở bài: DOL sẽ paraphrase đề bài để giới thiệu lại đề bài cho người chấm
Miêu tả tổng quát: DOL sẽ chỉ ra các đặc điểm quan trọng, nổi bật nhất trong hình
Thân bài:
Body 1: Mô tả số liệu từ năm 1920 đến năm 1945
Body 2: Mô tả số liệu từ năm 1945 đến năm 2000
📝 Bài mẫu
The graph displays the difference in
Overall, it is clear that even though both figures
In particular, the birth rates of China and the USA started at a relatively similar position of around 10 in 1920. Both figures varied considerably over the next 15-year period before dropping
The next 5 years witnessed a remarkable
(157 words)
📚 Vocabulary


✨ Bài tập Exercise
Mình cùng làm 2 bài tập sau đây để ôn lại các từ vựng và cấu trúc đã được dùng trong bài Sample nhé!
Exercise 1:
1 Tổng tỷ lệ thất nghiệp đang có xu hướng giảm và đã đạt mức trên 3%.
=> The total unemployment rate is on
2 Doanh số bán máy in và phần mềm cũng đạt mức cao nhất.
=> Printer and software sales also
3 Cuộc khủng hoảng kinh tế châu Á bắt đầu từ năm 1997 và chạm đáy vào năm 2000.
=> Asia economic crisis started in 1997 and
4 Từ năm 1955 đến năm 2000, tỷ lệ sinh của Trung Quốc giảm xuống còn 2 trong khi của Mỹ giảm dần xuống 7 vào cuối thế kỷ này.
=> Between 1955 and 2000, the birth rate of China
Exercise 2:
Điền từ/cụm từ thích hợp vào chỗ trống
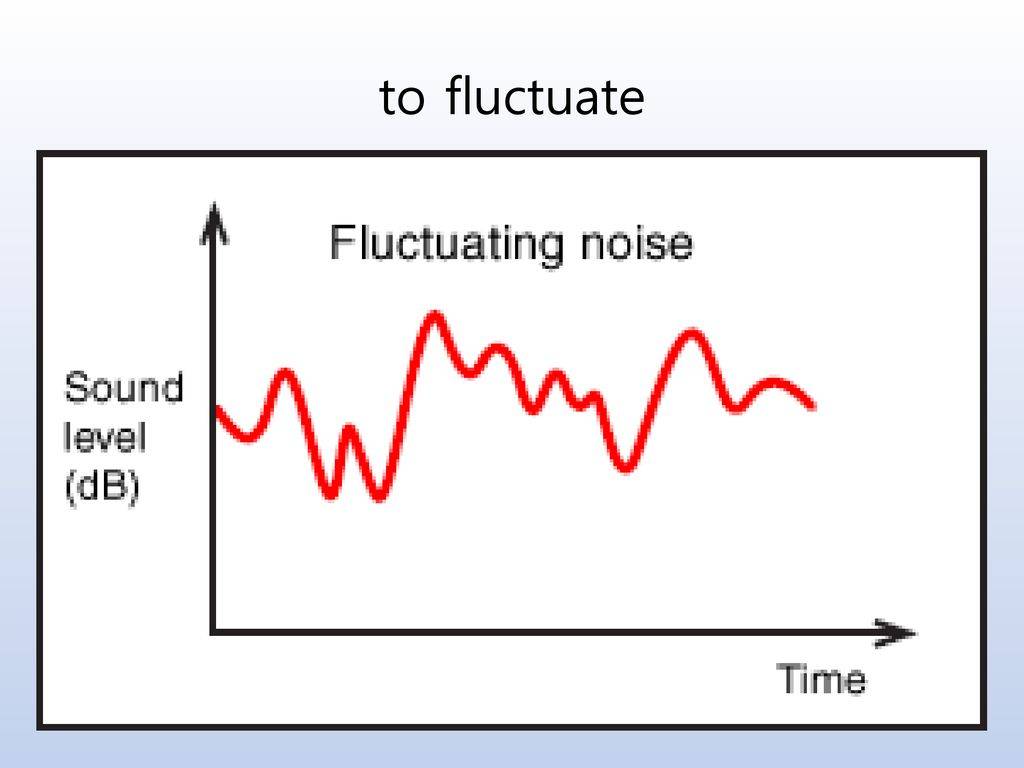
Dao động
Rõ nét, sắc nét
Tỉ lệ sinh
Bật trở lại, nẩy trở lại, phục hồi
Đề thi Writing Task 2 IELTS ngày 20/11/2021 và bài mẫu tham khảo hay.
Những đề thi hay tháng 11/2021.
💡 Lời kết
Tới đây là hết rồi  . Sau sample The graph below compares changes in the birth rates of China and the USA between 1920 – 2000. vừa rồi, DOL mong các bạn không chỉ nắm được cách trả lời cho dạng bài Line graph, mà còn học được những từ vựng và cấu trúc hay để miêu tả các biểu đồ tương tự nhé.
Nếu có thời gian thì nhớ làm phần bài tập và tự mình viết một bài khác nha vì 'Practice makes perfect' mà nhỉ? DOL chúc các bạn học tốt! 
Bài viết khác
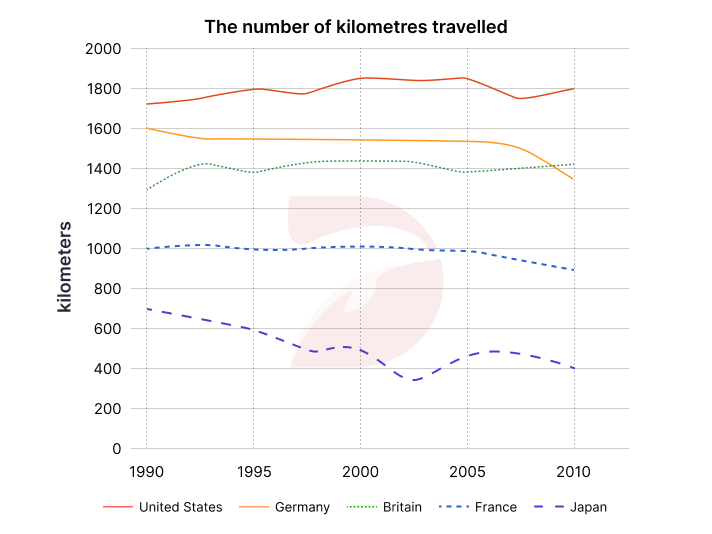
Đề thi IELTS Writing Task 1 ngày 20/04/2024 dạng Line graph: The line graph shows the number of kilometers traveled per car in five countries between 1990 and 2010. Summarise the information by selecting and reporting the main features, and make comparisons where relevant.
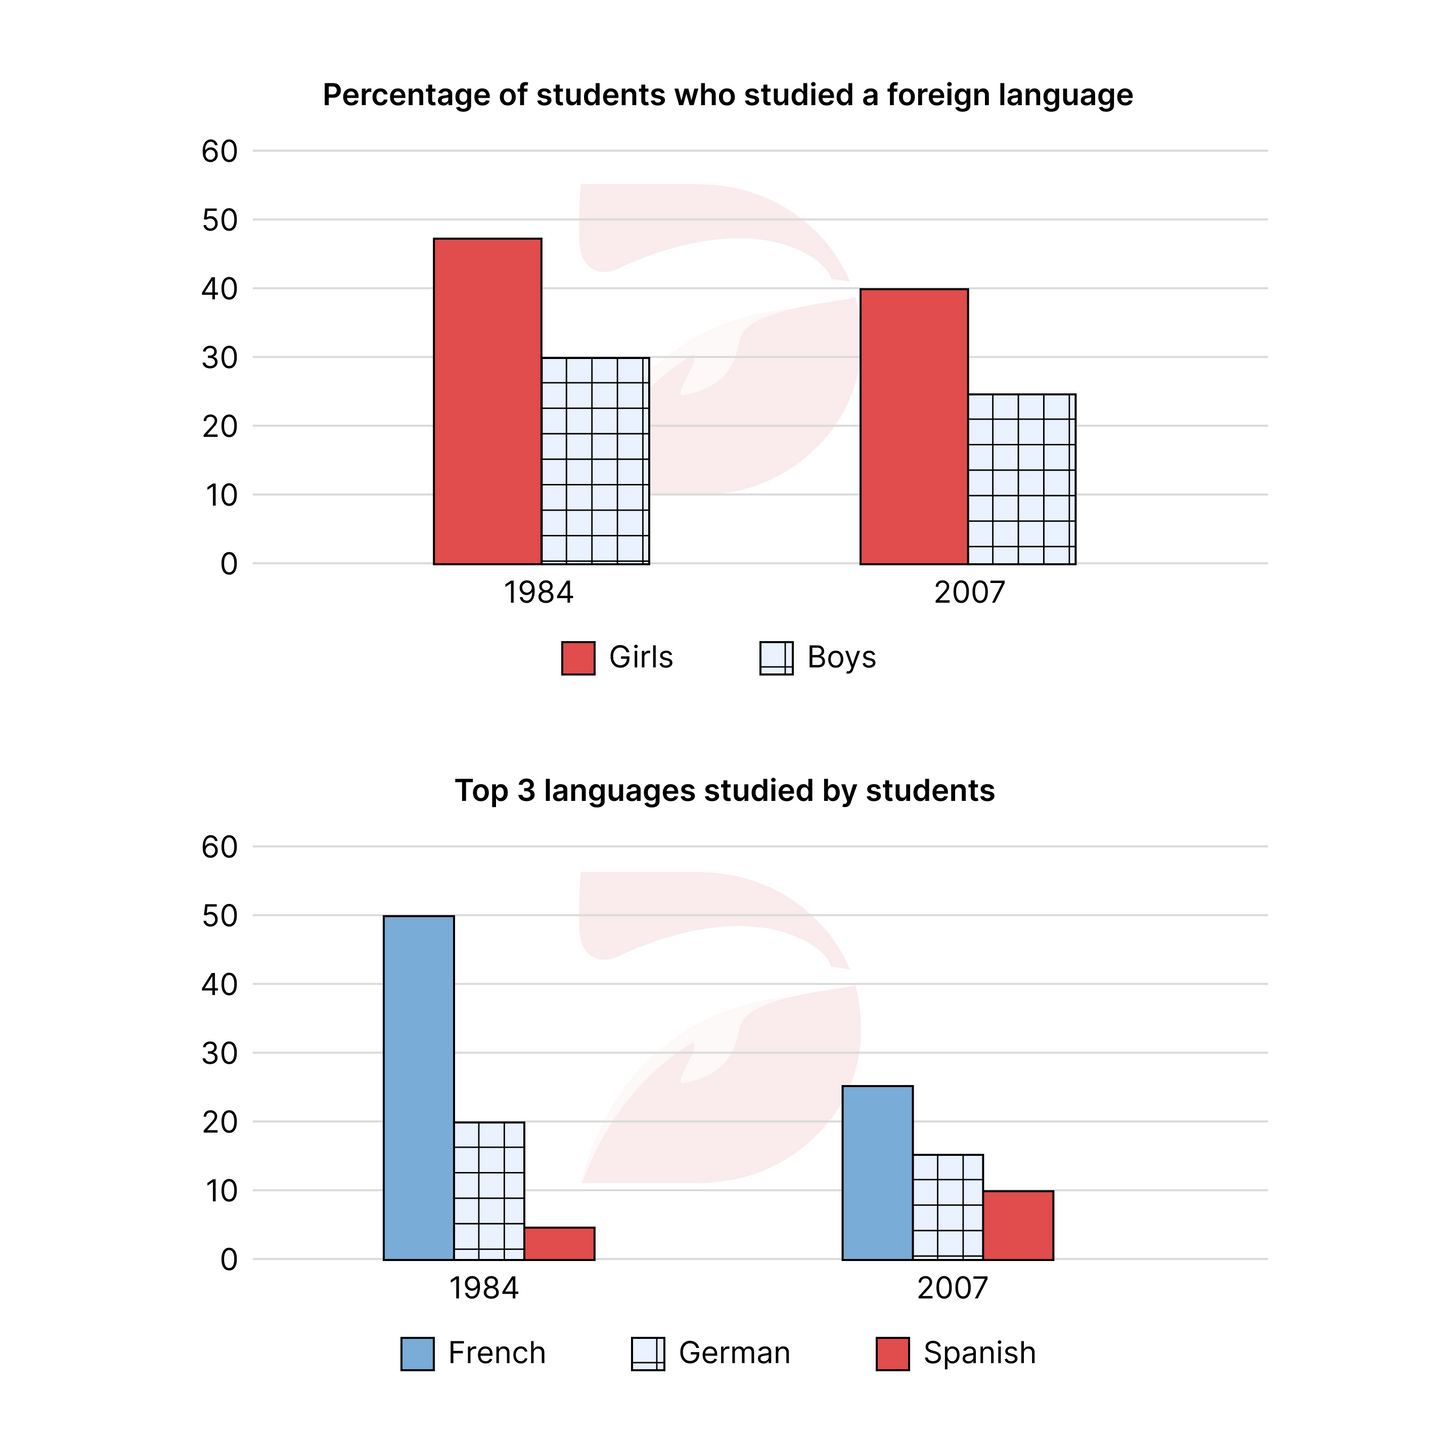
Đề thi IELTS Writing Task 1 ngày 06/04/2024 dạng Bar chart: The two bar charts show the proportion of 14 - 16 year-old students studying a modern foreign language in an English-speaking country, and the top three popular foreign languages. Summarize the information by selecting and reporting the main features, and make comparisons where relevant.
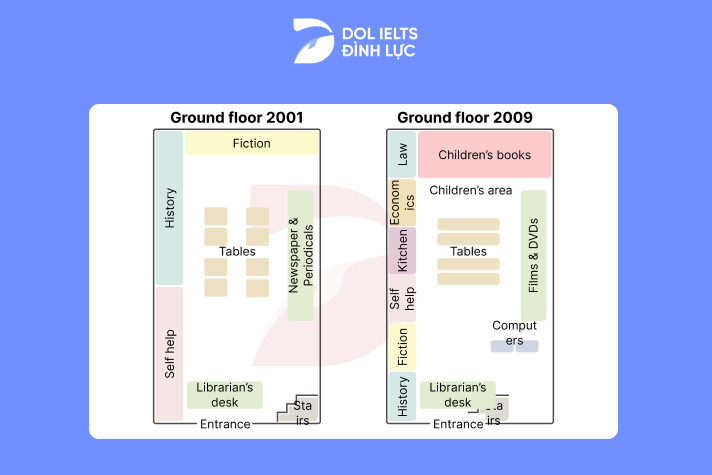
Đề thi IELTS Writing Task 1 ngày 09/03/2024 dạng Map: The plans below show the ground floor of a library in 2001 and how it was developed in 2009. Summarise the information by selecting and reporting the main features, and make comparisons where relevant.
Đề thi IELTS Writing Task 1 ngày 07/03/2024 dạng Line graph: The graph below shows the percentage of the Australian workforce in five industries between 1962 and 2012. Summarise the information by selecting and reporting the main features, and make comparisons where relevant.

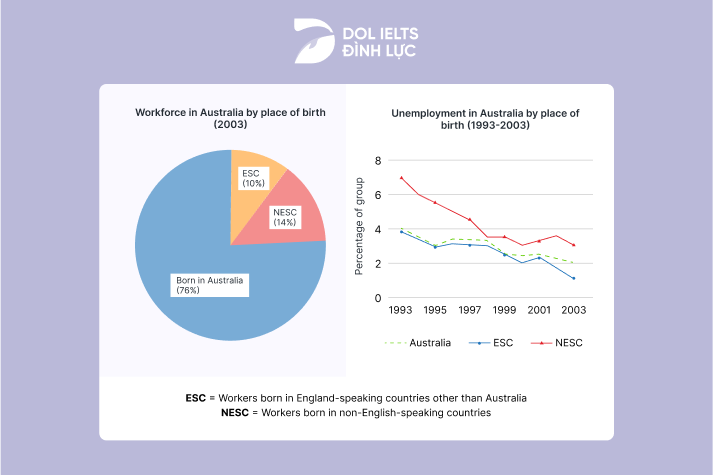
Đề thi IELTS Writing Task 1 ngày 17/02/2024 dạng Mixed Charts: The chart and graph below give information about three categories of workers in Australia and the unemployment levels within those groups. Summarise the information by selecting and reporting the main features, and make comparisons where relevant.