Kho đề thi IELTS Writing Task 1 chính thức - updated 2021
Tuy Task 1 trong phần thi Writing IELTS chỉ chiếm 1/3 số điểm nhưng nếu không làm được phần này thì tổng điểm Writing sẽ bị ảnh hưởng rất nhiều. Hơn nữa, dù đây là phần thi không đòi hỏi kiến thức xã hội như Task 2 nhưng thí sinh cần phải nắm được phương pháp viết các dạng biểu đồ phù hợp, nếu không sẽ dễ dẫn đến việc diễn đạt lan man hoặc rơi vào tình huống liệt kê số liệu chứ không phải so sánh. Do đó, việc chuẩn bị, ôn tập kỹ Writing Task 1 là vô cùng cần thiết. Trong bài viết này DOL sẽ tổng hợp đề thi IELTS Writing Task 1 kèm bài mẫu cho các bạn tham khảo cũng như nắm được những dạng đề trong phần thi Writing Task 1 để có sự chuẩn bị thật tốt cho kỳ thi sắp tới.
DOL IELTS Đình Lực
Feb 22, 2023
2 mins read

Table of content
✏️ Đề thi IELTS Writing Task 1 ngày 29/05/2021
✏️ Đề thi IELTS Writing Task 1 ngày 22/05/2021
✏️ Đề thi IELTS Writing Task 1 ngày 15/05/2021
✏️ Đề thi IELTS Writing Task 1 ngày 08/05/2021
✏️ Đề thi IELTS Writing Task 1 ngày 29/04/2021
✏️ Đề thi IELTS Writing Task 1 ngày 24/04/2021
✏️ Đề thi IELTS Writing Task 1 ngày 17/04/2021
✏️ Đề thi IELTS Writing Task 1 ngày 10/04/2021
✏️ Đề thi IELTS Writing Task 1 ngày 27/03/2021
✏️ Đề thi IELTS Writing Task 1 ngày 20/03/2021
✏️ Đề thi IELTS Writing Task 1 ngày 13/03/2021
✏️ Đề thi IELTS Writing Task 1 ngày 27/02/2021
✏️ Đề thi IELTS Writing Task 1 ngày 25/02/2021
✏️ Đề thi IELTS Writing Task 1 ngày 20/02/2021
✏️ Đề thi IELTS Writing Task 1 ngày 06/02/2021
✏️ Đề thi IELTS Writing Task 1 ngày 23/01/2021
✏️ Đề thi IELTS Writing Task 1 ngày 21/01/2021
✏️ Đề thi IELTS Writing Task 1 ngày 16/01/2021
✏️ Đề thi IELTS Writing Task 1 ngày 09/01/2021
✏️ Đề thi IELTS Writing Task 1 ngày 19/12/2020
✏️ Đề thi IELTS Writing Task 1 ngày 05/12/2020
✏️ Đề thi IELTS Writing Task 1 ngày 24/10/2020
✏️ Đề thi IELTS Writing Task 1 ngày 31/10/2020
✏️ Đề thi IELTS Writing Task 1 ngày 15/10/2020
✏️ Đề thi IELTS Writing Task 1 ngày 10/10/2020
✏️ Đề thi IELTS Writing Task 1 ngày 17/09/2020
✏️ Đề thi IELTS Writing Task 1 ngày 12/09/2020
✏️ Đề thi IELTS Writing Task 1 ngày 05/09/2020
✏️ Đề thi IELTS Writing Task 1 ngày 22/08/2020
✏️ Đề thi IELTS Writing Task 1 ngày 23/07/2020
✏️ Đề thi IELTS Writing Task 1 ngày 11/07/2020
✏️ Đề thi IELTS Writing Task 1 ngày 09/07/2020
✏️ Đề thi IELTS Writing Task 1 ngày 02/07/2020
✏️ Đề thi IELTS Writing Task 1 ngày 20/06/2020
✏️ Đề thi IELTS Writing Task 1 ngày 13/06/2020
✏️ Đề thi IELTS Writing Task 1 ngày 06/06/2020
✏️ Đề thi IELTS Writing Task 1 ngày 28/05/2020
✏️ Đề thi IELTS Writing Task 1 ngày 25/05/2020
✏️ Đề thi IELTS Writing Task 1 ngày 21/05/2020
✏️ Đề thi IELTS Writing Task 1 ngày 16/05/2020
✏️ Đề thi IELTS Writing Task 1 ngày 21/03/2020
✏️ Đề thi IELTS Writing Task 1 ngày 18/01/2020
✏️ Đề thi IELTS Writing Task 2 ngày 30/11/2019
✏️ Đề thi IELTS Writing Task 1 ngày 10/10/2019
✏️ Đề thi IELTS Writing Task 1 ngày 02/02/2019
✏️ Đề thi IELTS Writing Task 1 ngày 19/01/2019
✏️ Đề thi IELTS Writing Task 1 ngày 15/09/2018
✏️ Đề thi IELTS Writing Task 1 ngày 10/02/2018
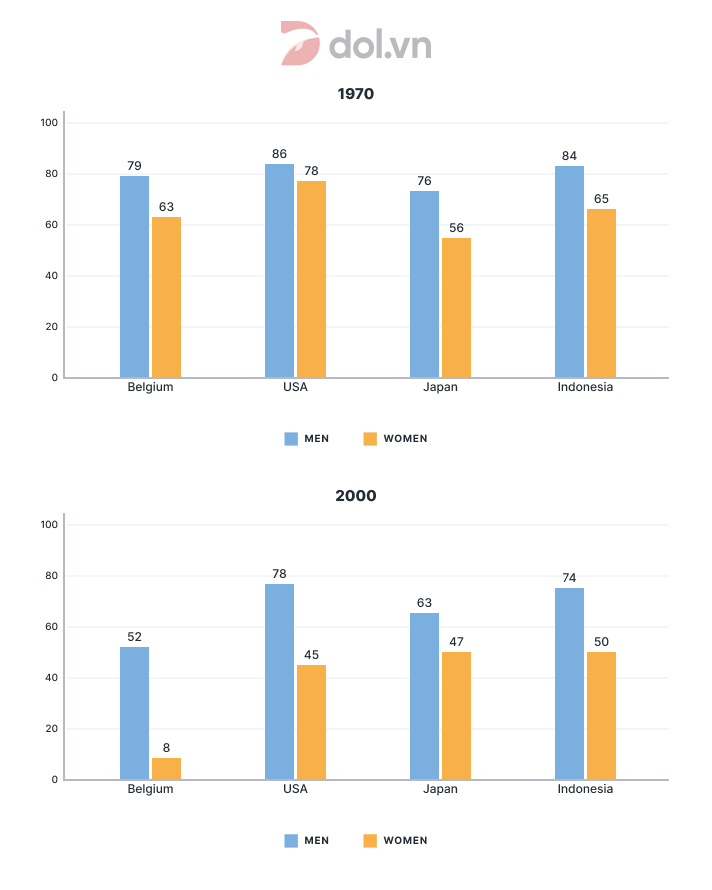
✏️ Đề IELTS Writing Task 1 ngày 29/05/2021
The graphs below show the percentage of men and women aged 60-64 who were employed in four countries in 1970 and 2000.
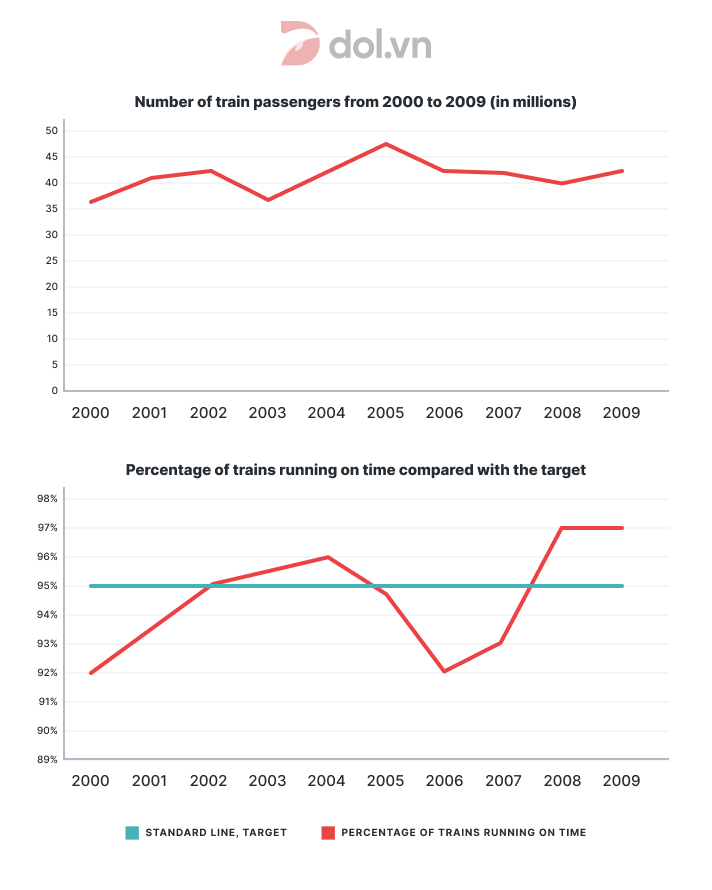
✏️ Đề thi IELTS Writing Task 1 ngày 22/05/2021
The first graph shows the number of train passengers from 2000 to 2009; the second compares the percentage of trains running on time and target in the period.
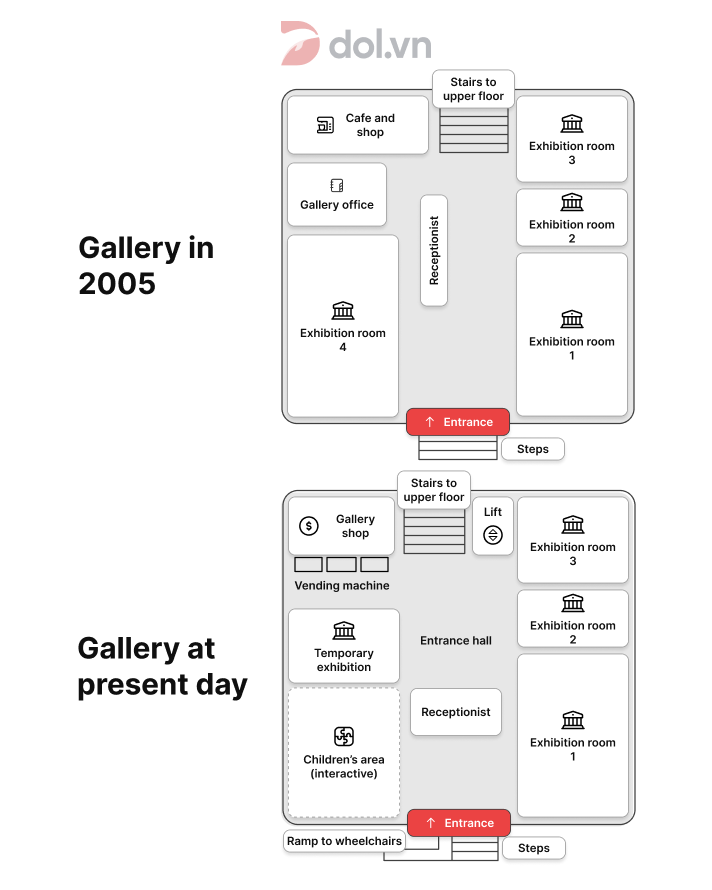
✏️ Đề IELTS Writing Task 1 ngày 15/05/2021
The maps below show the changes in the art gallery ground floor in 2015 and present day.
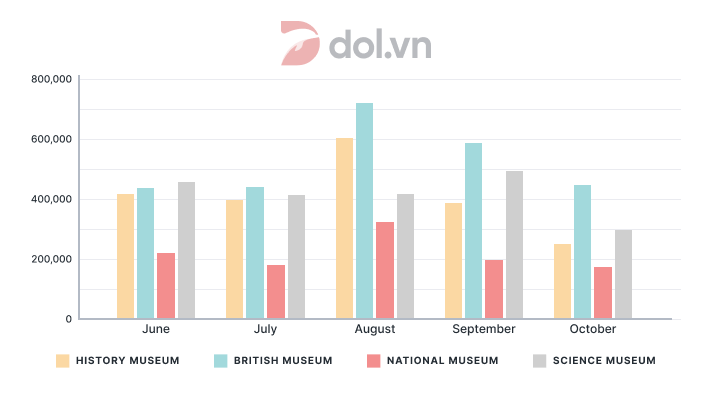
✏️ Đề thi IELTS Writing Task 1 ngày 08/05/2021
The bar chart shows the number of people who visited different museums in London.
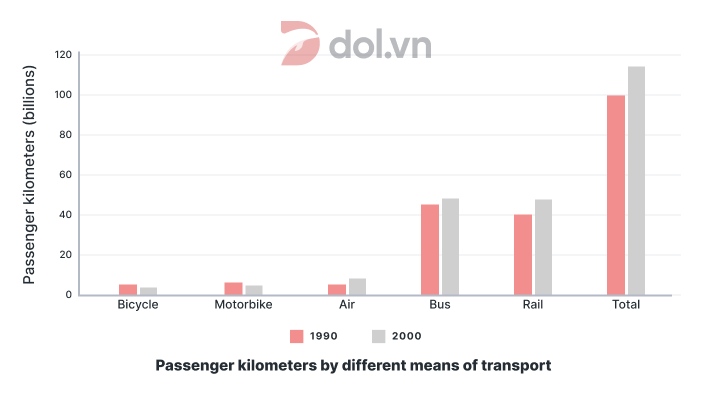
✏️ Đề thi IELTS Writing Task 1 ngày 29/04/2021
The bar chart below shows the passenger kilometres traveled by different means of transport in the UK in 1990 and 2000.
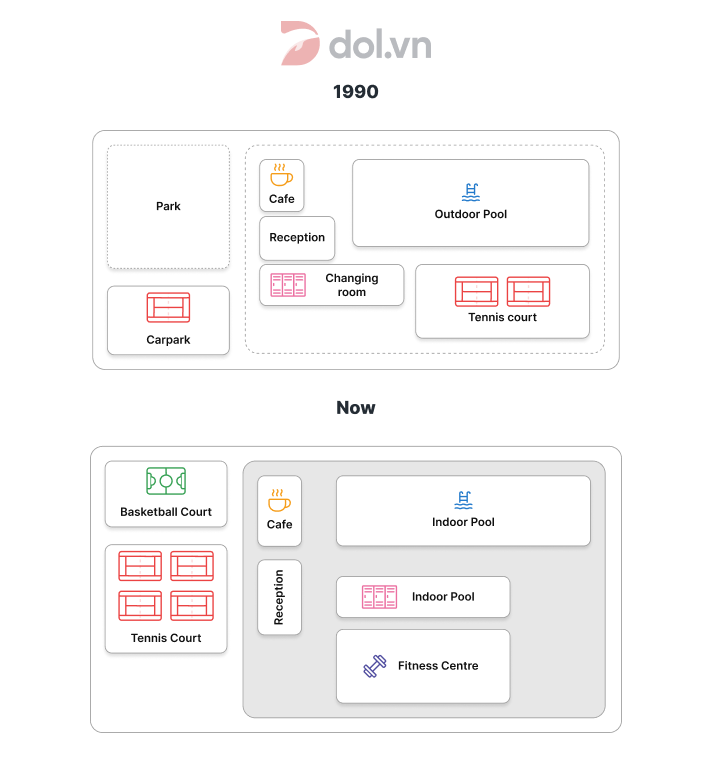
✏️ Đề IELTS Writing Task 1 ngày 24/04/2021
The maps give information about a university sports court.
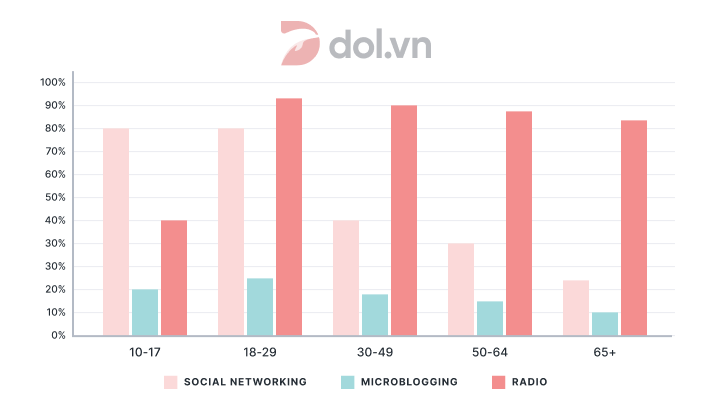
✏️ Đề thi IELTS Writing Task 1 ngày 17/04/2021
The bar chart shows type of media to get daily news, by age group 2011.
✏️ Đề thi IELTS Writing Task 1 ngày 10/04/2021
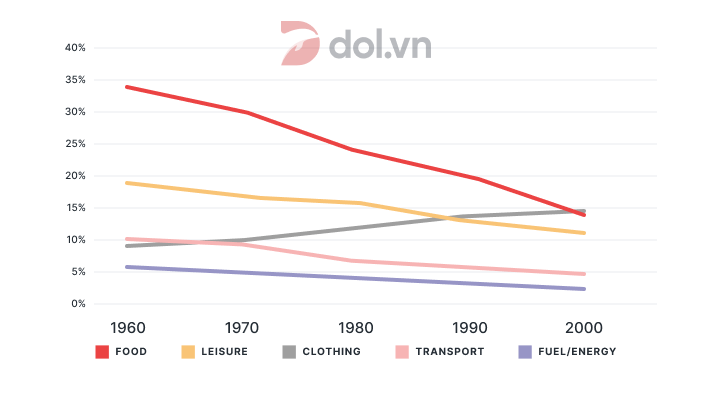
The line graph illustrates the proportion of total expenditure in a certain European country between 1960 and 2000.
✏️ Đề IELTS Writing Task 1 ngày 27/03/2021
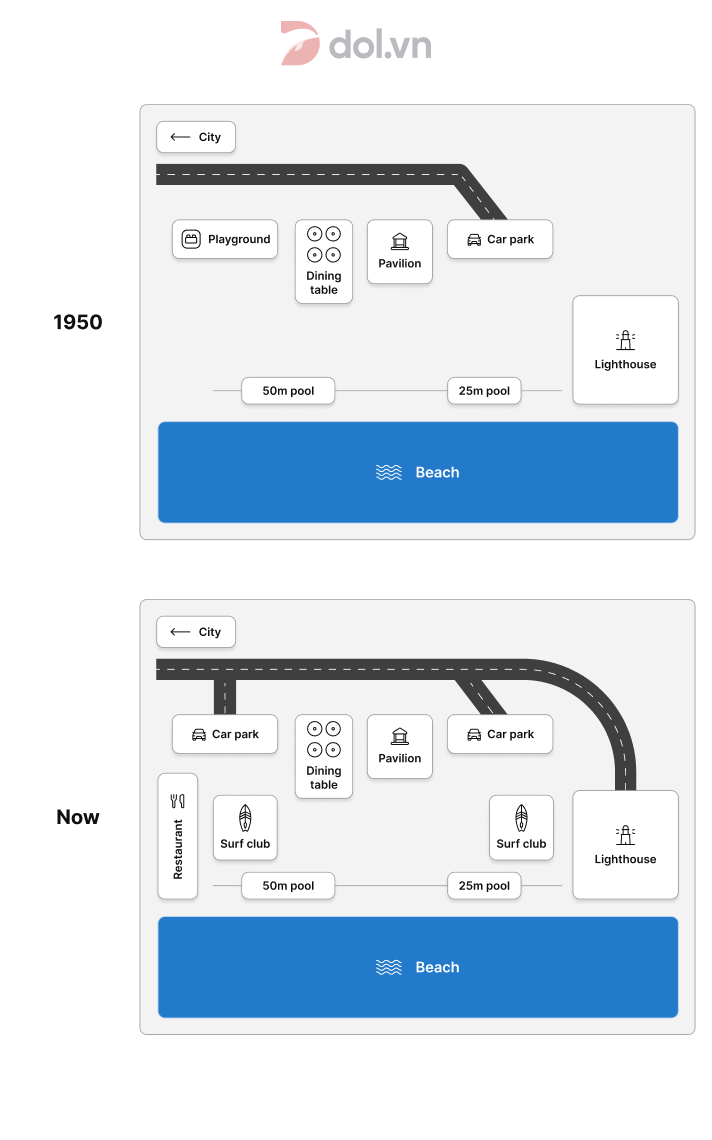
The maps below show a beachfront area in Australia in 1950 and today.
✏️ Đề thi IELTS Writing Task 1 ngày 20/03/2021
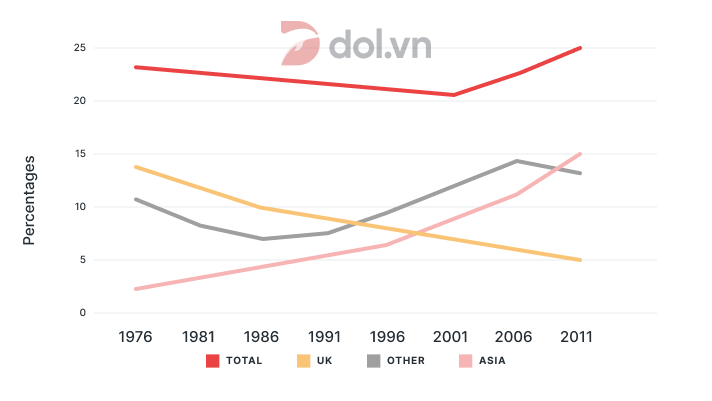
The graph below gives information about the percentage of people living in Australia who were born in Asia, the UK, and other regions.
✏️ Đề thi IELTS Writing Task 1 ngày 13/03/2021
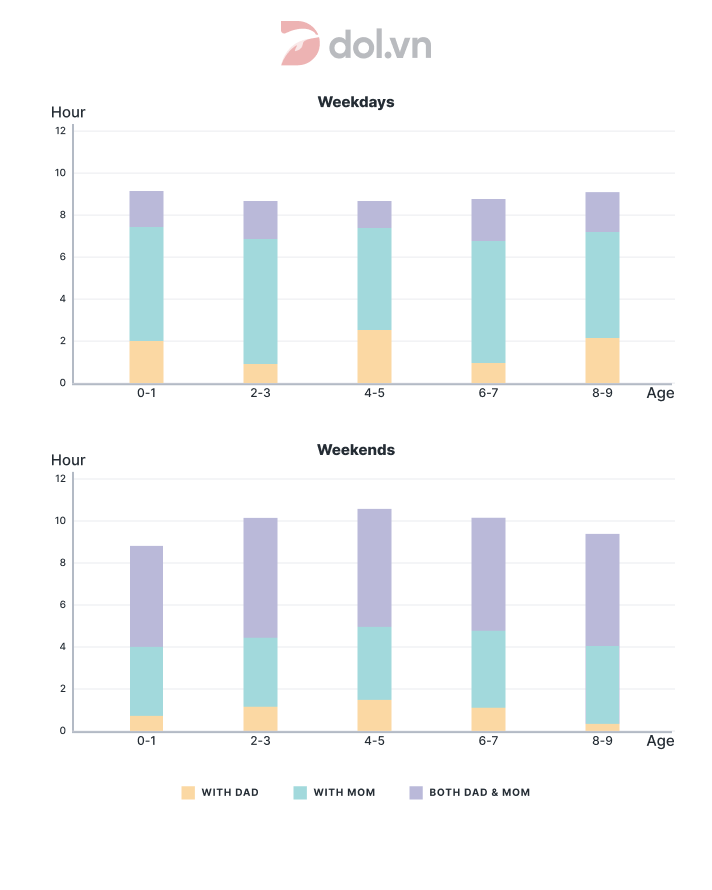
The chart below gives information about the amount of time children spend with their parents.
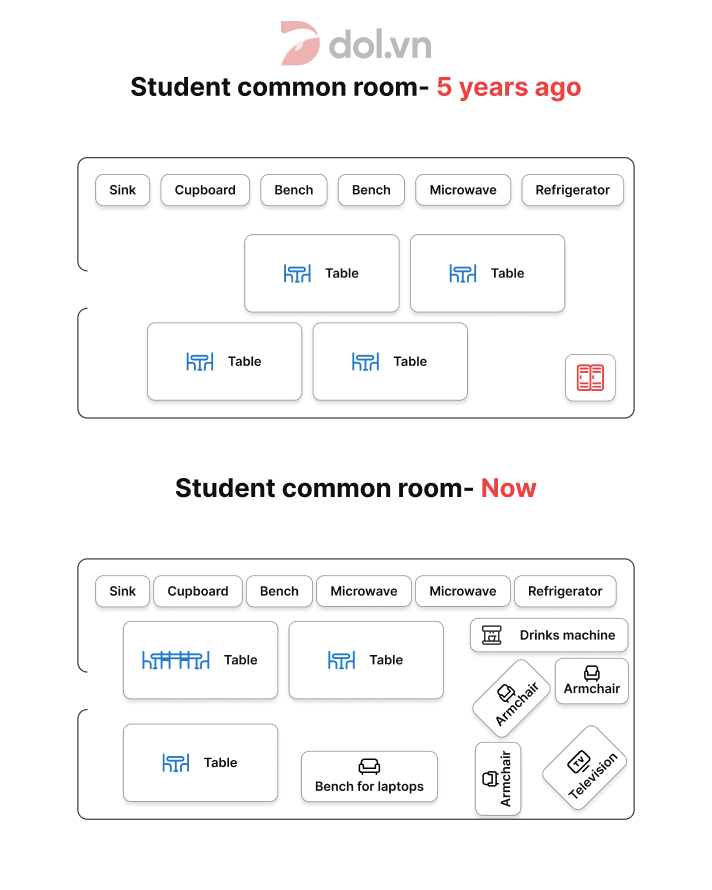
✏️ Đề IELTS Writing Task 1 ngày 27/02/2021
The diagrams show changes in a student common room.
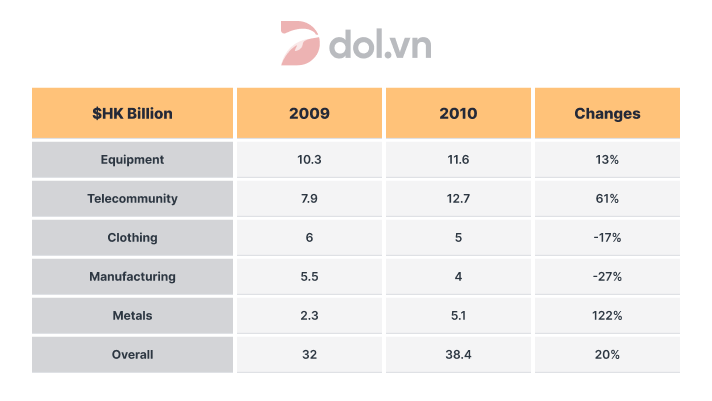
✏️ Đề thi IELTS Writing Task 1 ngày 25/02/2021
The table shows the export values of various products in 2009 and 2010.
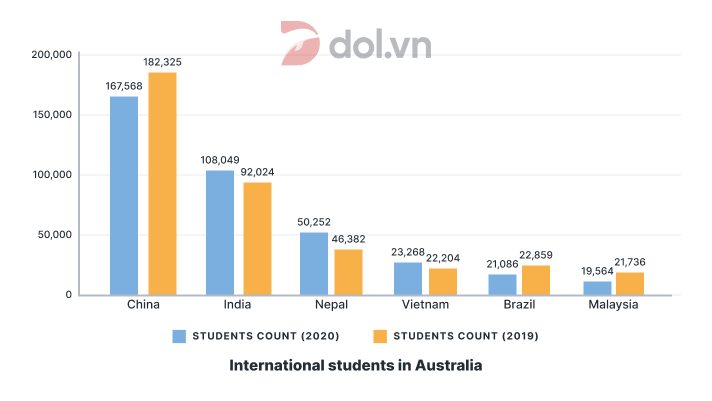
✏️ Đề IELTS Writing Task 1 ngày 20/02/2021
The chart below shows changes in the number of international students in Australia in 2019 and 2020.
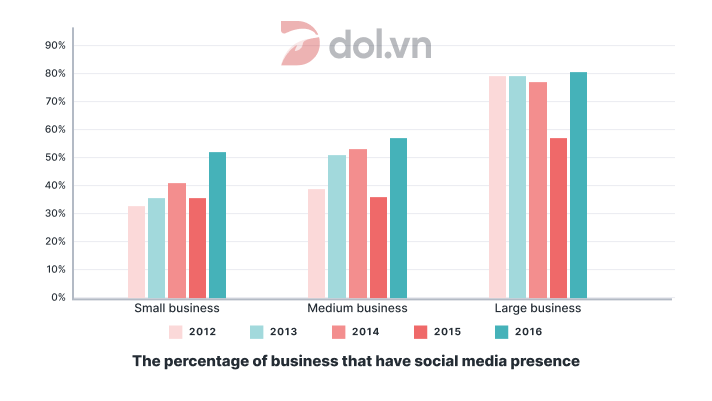
✏️ Đề thi IELTS Writing Task 1 ngày 06/02/2021
The bar chart shows the percentage of small , medium, large companies which used social media for business purposes between 2012 to 2016.
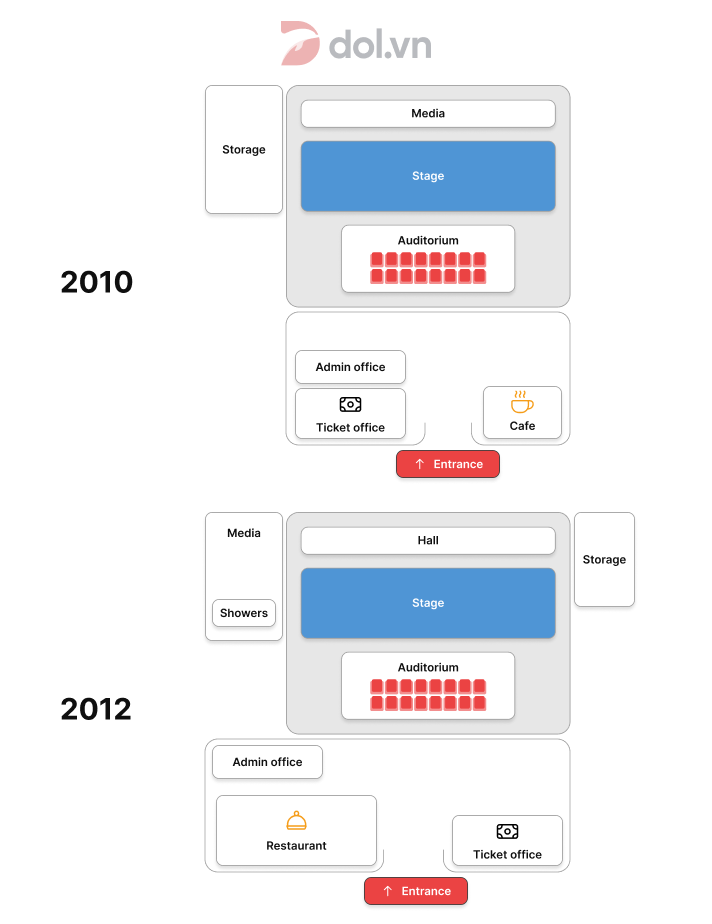
✏️ Đề thi IELTS Writing Task 1 ngày 23/01/2021
The plans show the change of a small theater in 2010 and 2012.
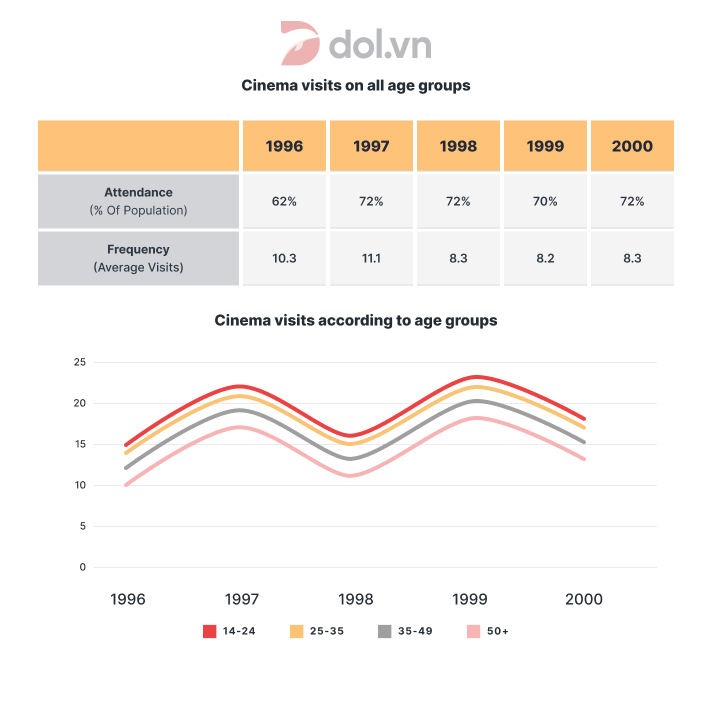
✏️ Đề IELTS Writing Task 1 ngày 21/01/2021
The graphs below show the cinema attendance in Australia and the average cinema visits by different age groups from 1996 to 2000.
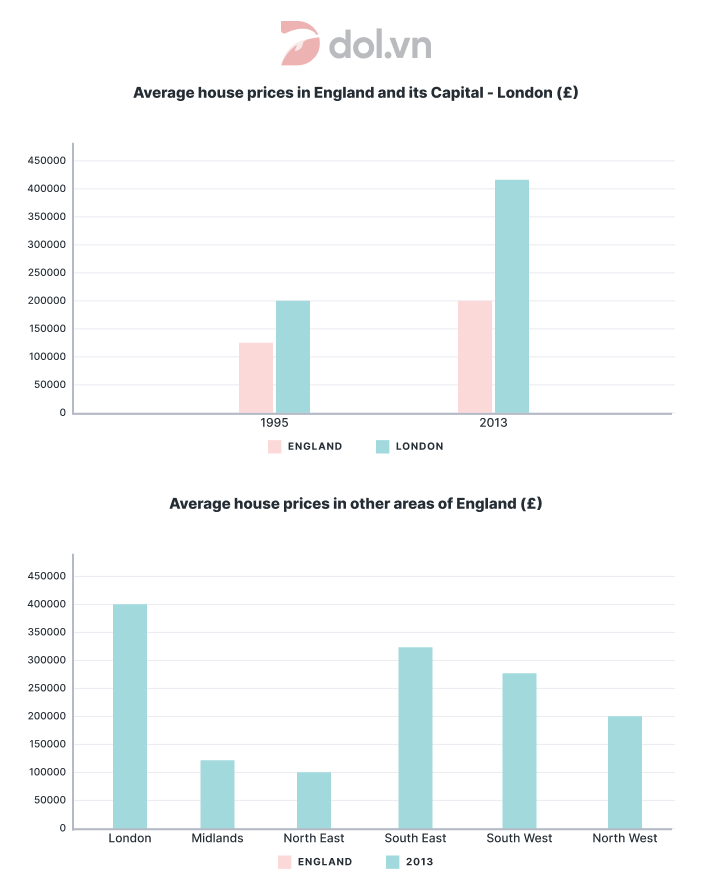
✏️ Đề thi IELTS Writing Task 1 ngày 16/01/2021
The bar charts illustrate the average house expenses in England and its capital city – London, and to present the comparison regarding the average house prices between distinct areas of England within the year 2013.
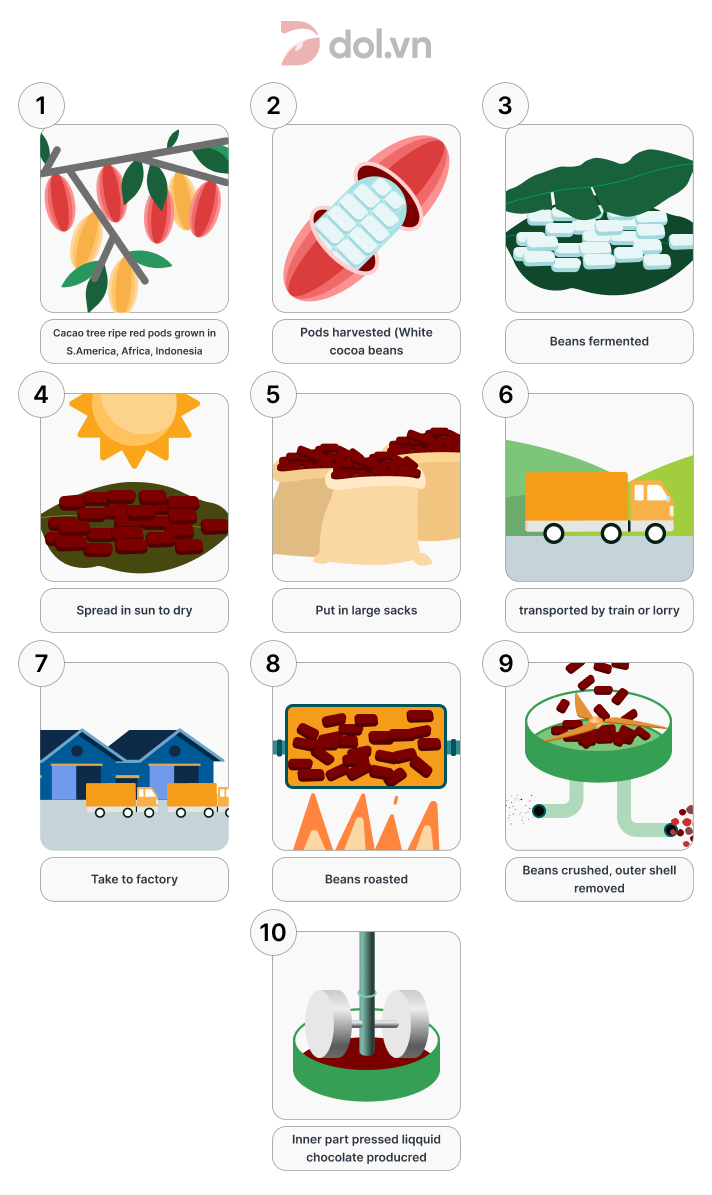
✏️ Đề thi IELTS Writing Task 1 ngày 09/01/2021
The diagram shows how chocolate is produced. Summarize the information by selecting and reporting the main features and make comparisons where relevant.
✏️ Đề IELTS Writing Task 1 ngày 19/12/2020
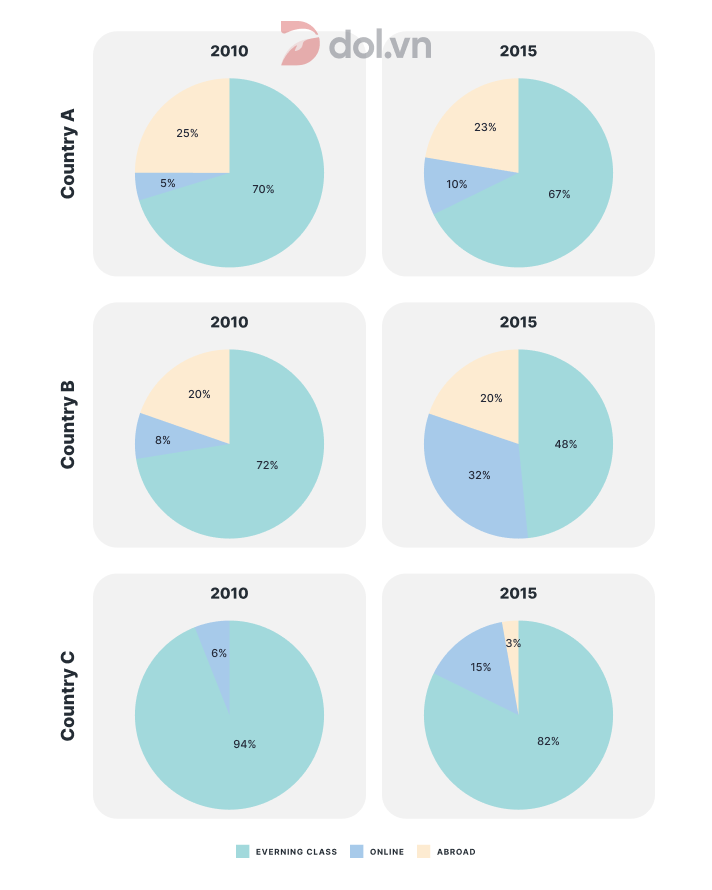
The chart show the different how three countries learn English in 2010 and 2015.
✏️ Đề thi IELTS Writing Task 1 ngày 05/12/2020
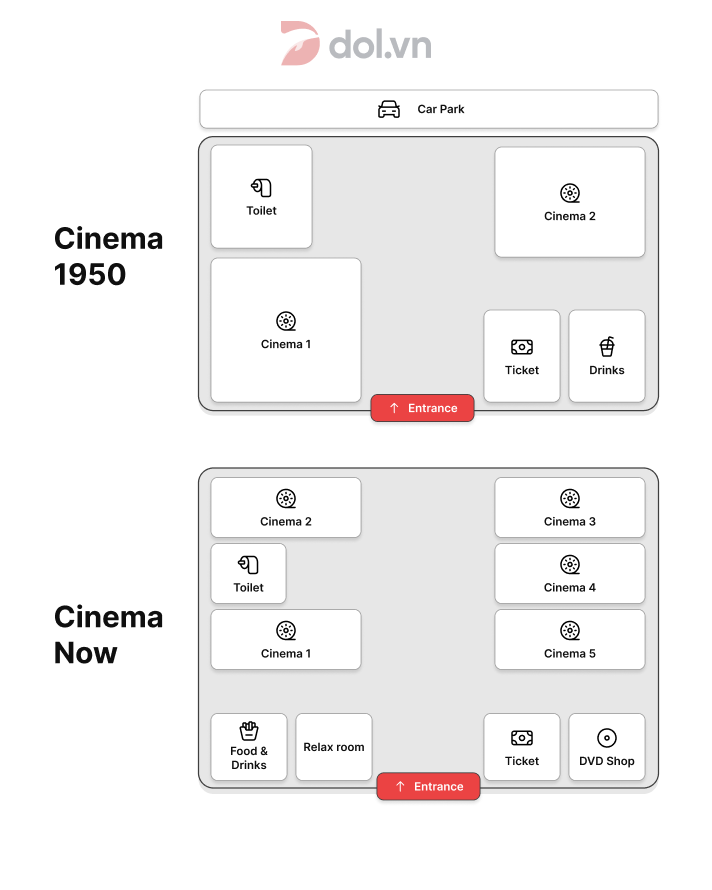
The diagrams below show changes of a cinema from 1980 until now.
✏️ Đề thi IELTS Writing Task 1 ngày 24/10/2020
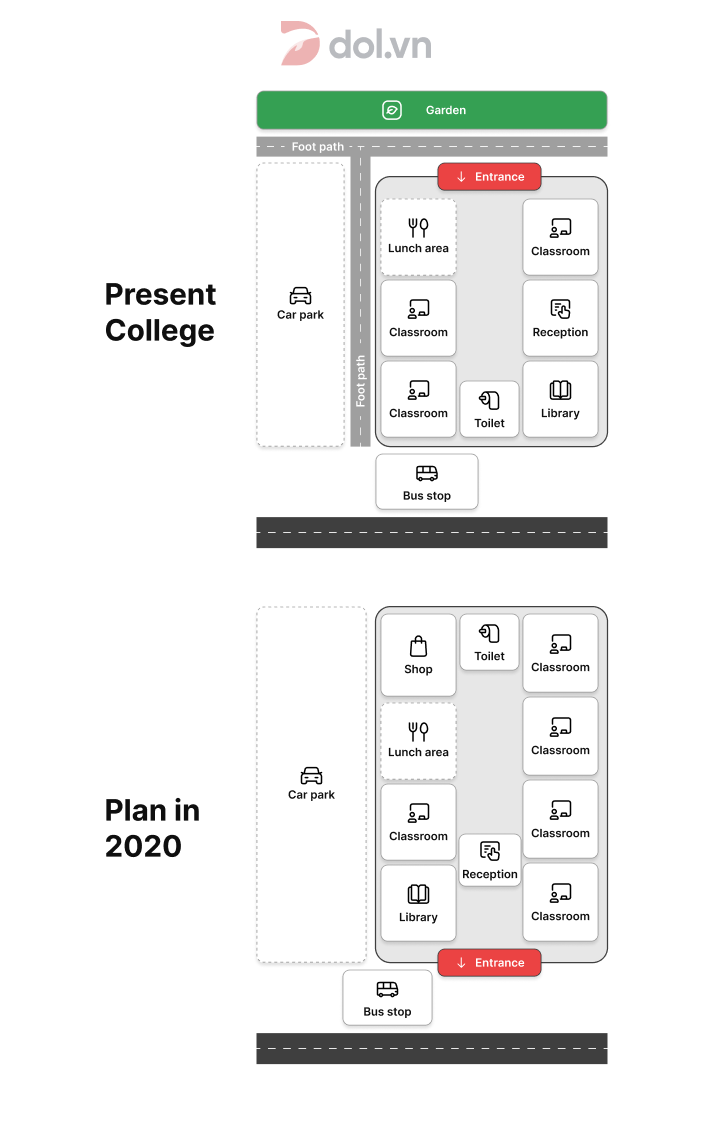
The diagrams below show the present building of a college and the plan for changes to the college site in the future.
✏️ Đề IELTS Writing Task 1 ngày 31/10/2020
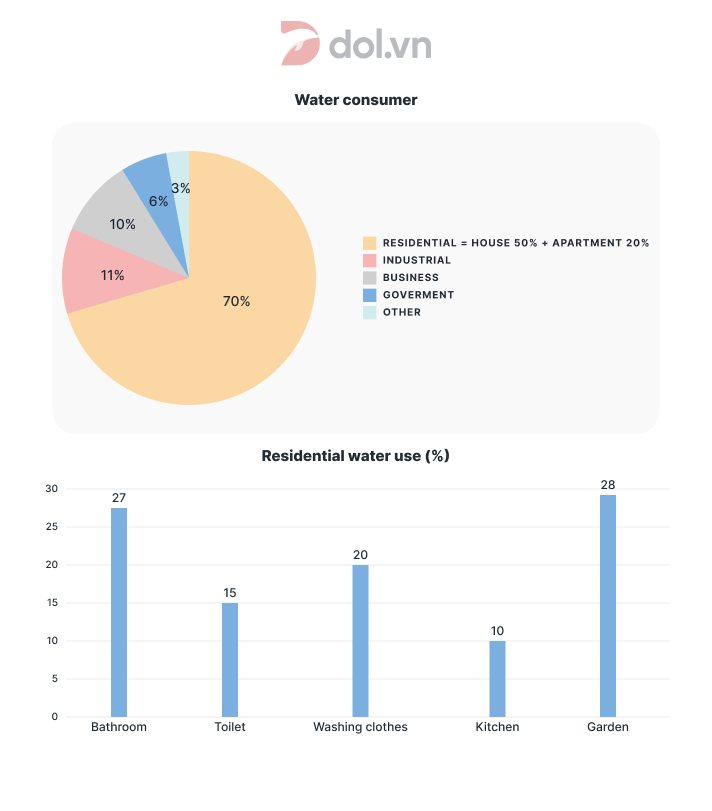
The pie and bar charts below show the percentage of water consumption and use in Australia in 2004.
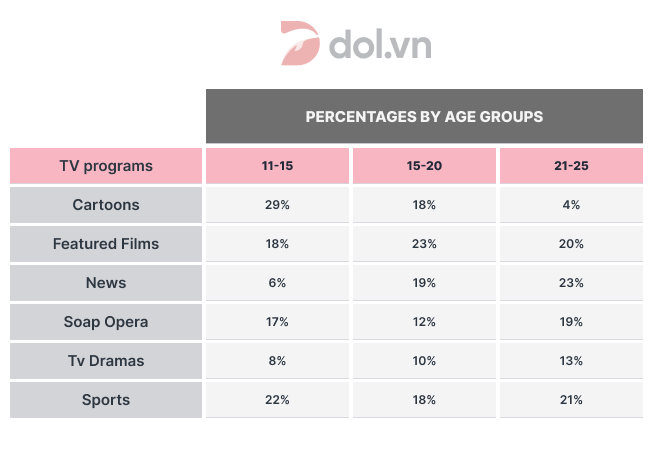
✏️ Đề thi IELTS Writing Task 1 ngày 15/10/2020
The table below shows a survey on the preference of different age groups in a European country on different TV programmes in 2012.
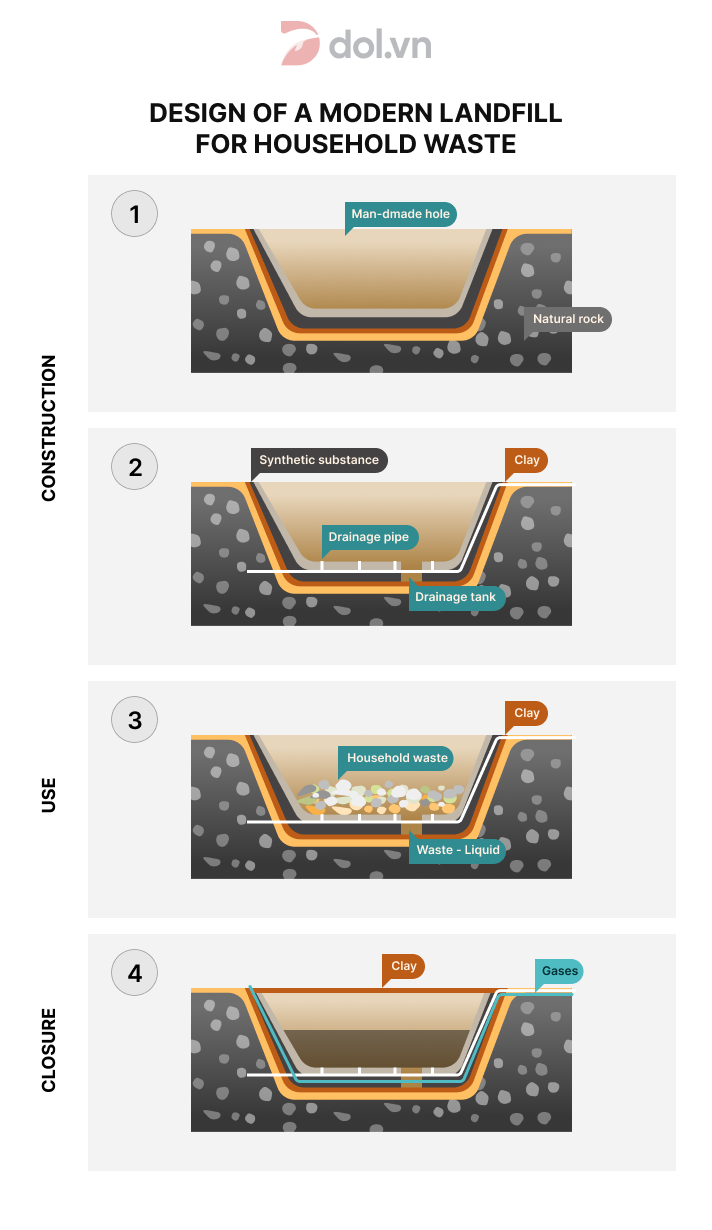
✏️ Đề thi IELTS Writing Task 1 ngày 10/10/2020
The diagram shows the design of a modern landfill for household waste.
✏️ Đề IELTS Writing Task 1 ngày 17/09/2020
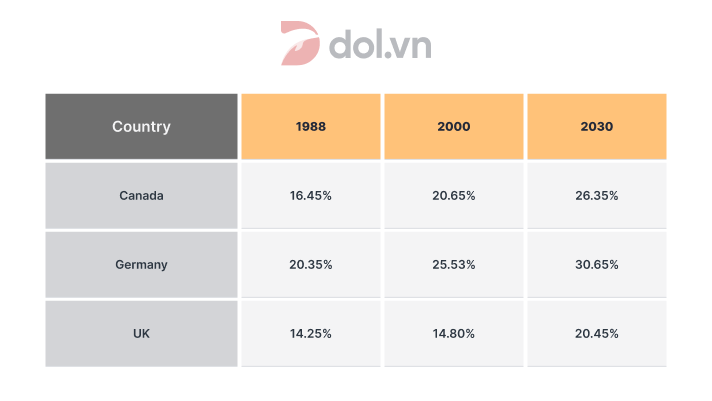
The table below shows information and predictions regarding the change in the percentage of the population aged 65 and above in three countries.
✏️ Đề thi IELTS Writing Task 1 ngày 12/09/2020
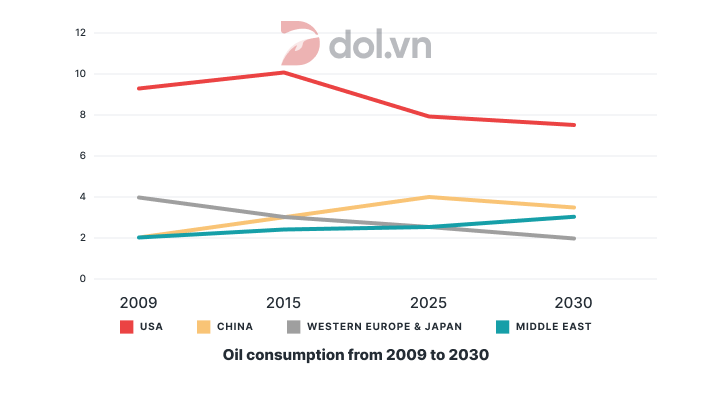
The graph below shows information about the total oil consumption of four major consumers from 2009 to 2030.
✏️ Đề IELTS Writing Task 1 ngày 05/09/2020
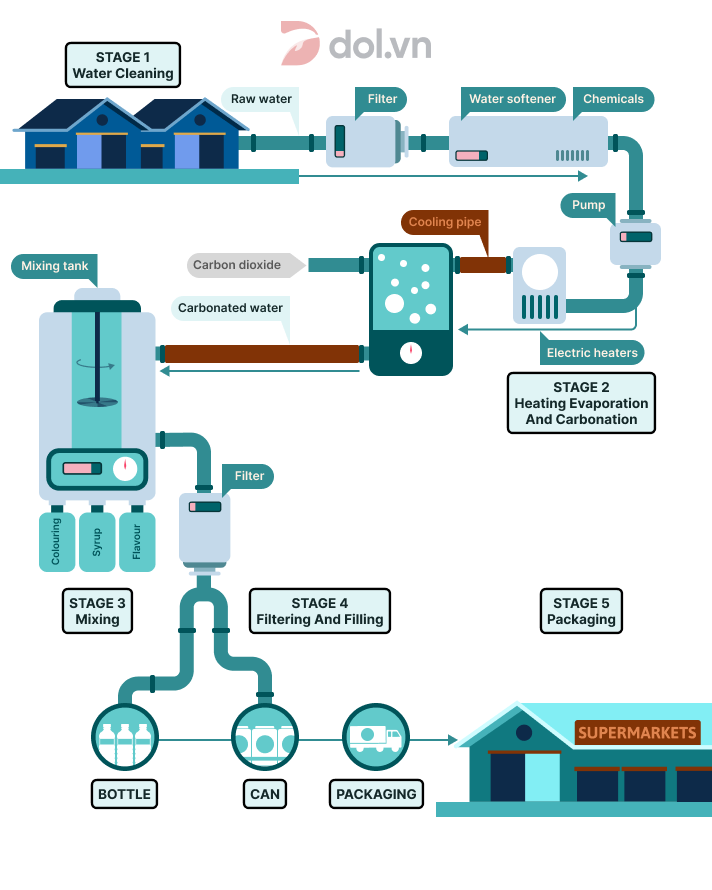
The diagram gives information about the process of making carbonated drinks.
✏️ Đề thi IELTS Writing Task 1 ngày 22/08/2020
The table below shows the average weekly salaries of men and of women working in different occupations.

✏️ Đề thi IELTS Writing Task 1 ngày 23/07/2020
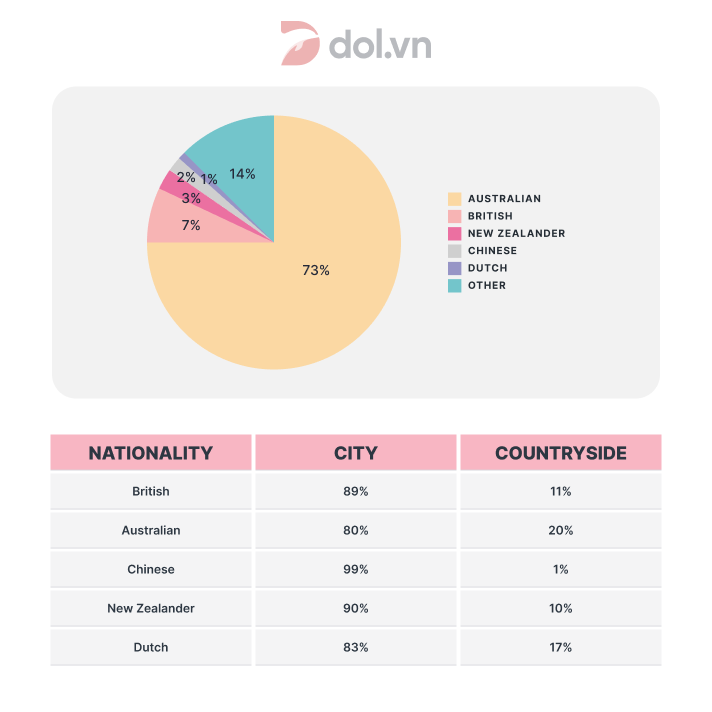
The table and pie chart give information about the population in Australia according to different nationalities and areas.
✏️ Đề thi IELTS Writing Task 1 ngày 11/07/2020
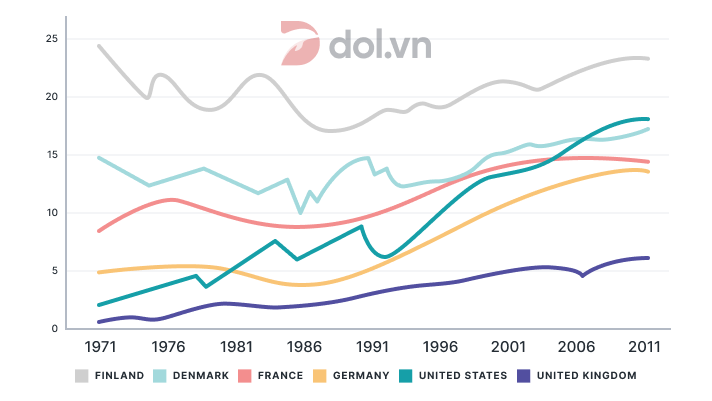
The picture below shows the use of renewable energy accounting the total energy from 1971 to 2011.
✏️ Đề IELTS Writing Task 1 ngày 09/07/2020
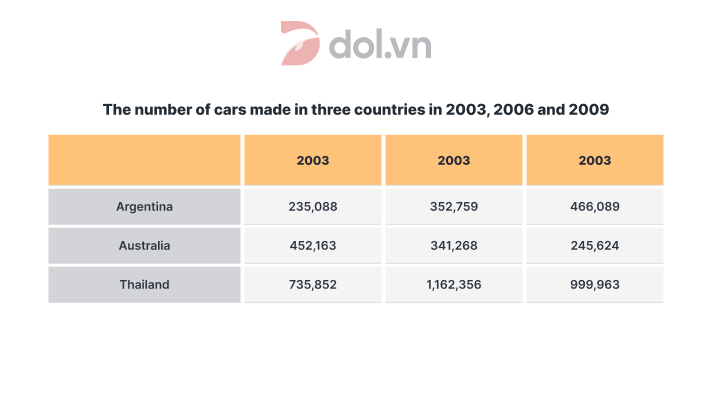
The table below shows the number of cars made in three countries in 2003, 2006 and 2009.
✏️ Đề thi IELTS Writing Task 1 ngày 02/07/2020
The table below shows information and predictions regarding the change in percentage of population aged 65 and above in three countries.

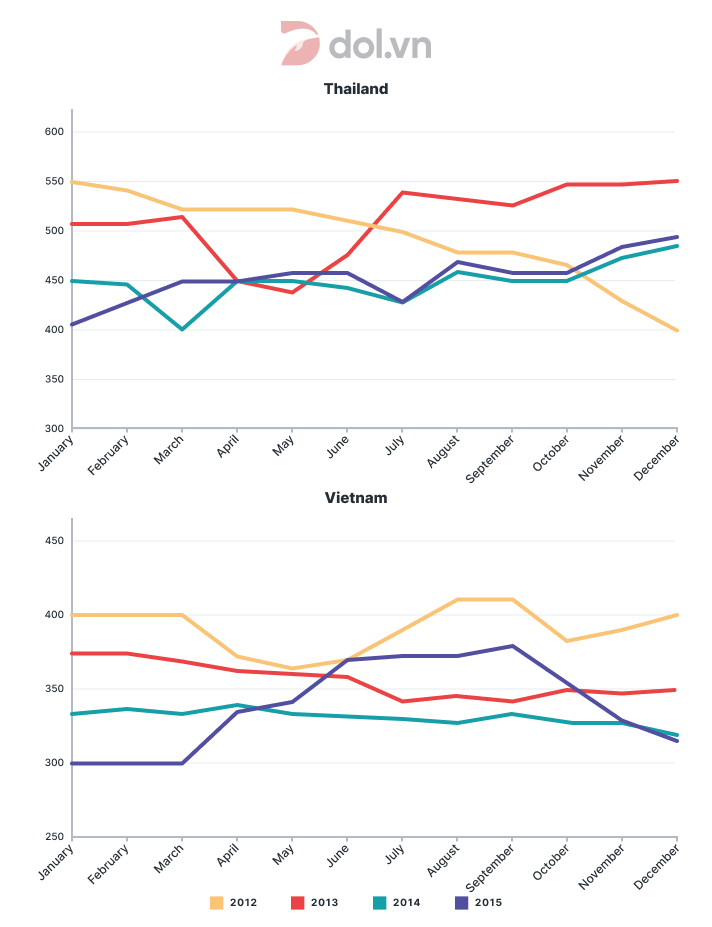
✏️ Đề thi IELTS Writing Task 1 ngày 20/06/2020
The monthly price of exported rice from ThaiLand and VietNam from 2012 to 2015 (Million dollars per tons)
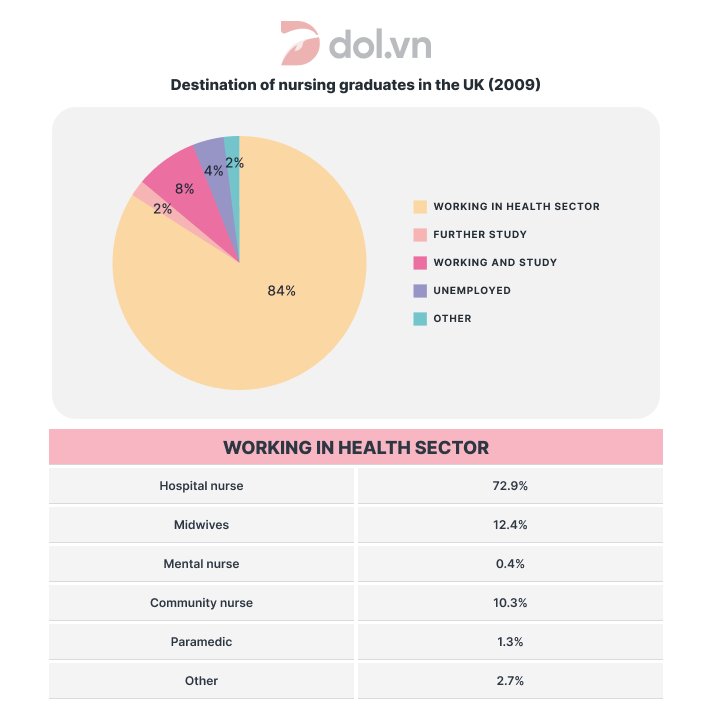
✏️ Đề thi IELTS Writing Task 1 ngày 13/06/2020
The chart and table below give information about what nursing graduates did after finishing their course in the UK in 2009.
✏️ Đề thi IELTS Writing Task 1 ngày 06/06/2020
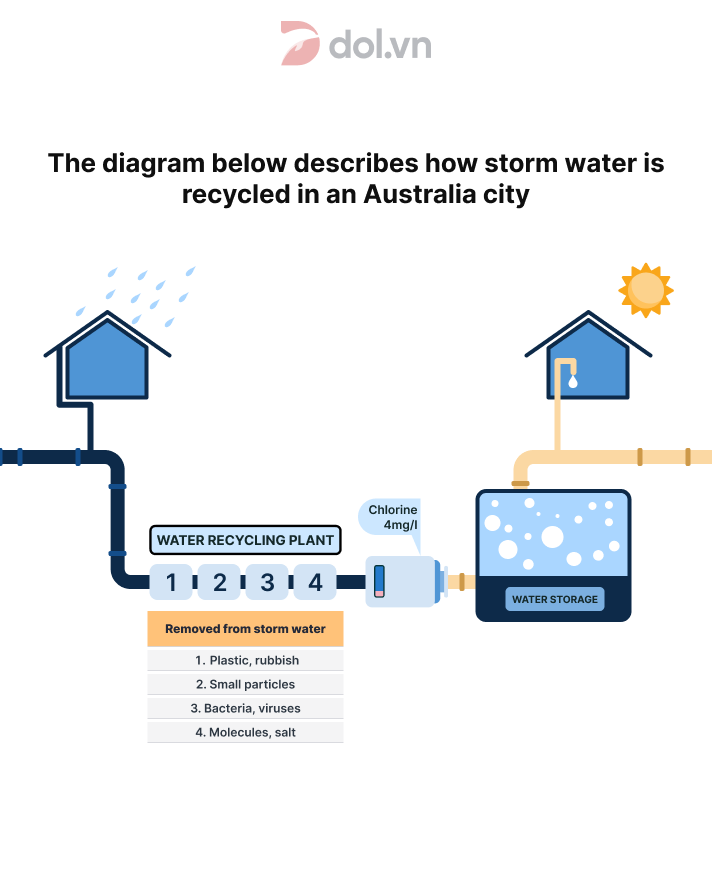
The diagram below describes how storm water is recycled in an Australian city.
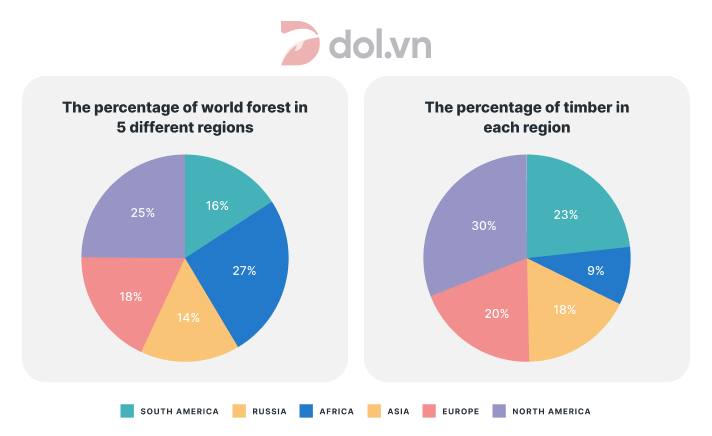
✏️ Đề thi IELTS Writing Task 1 ngày 28/05/2020
The charts give information about world forest in five different regions.
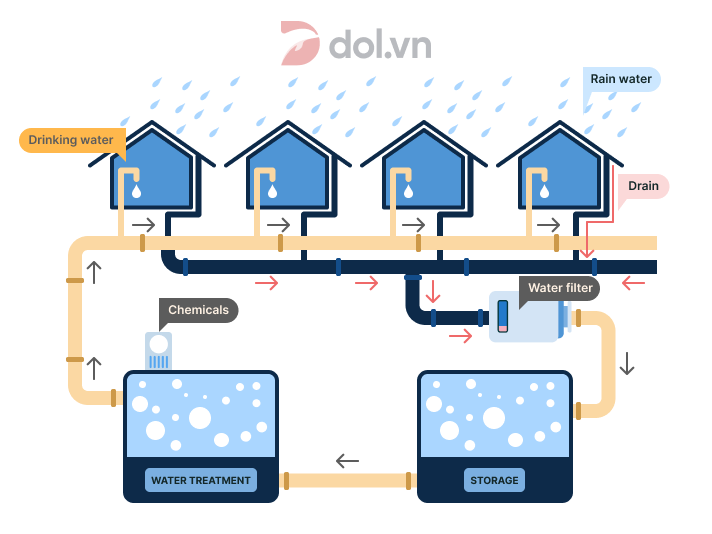
✏️ Đề IELTS Writing Task 1 ngày 25/05/2020
The diagram shows rainwater is collected for the use of drinking water in an Australian town.
✏️ Đề thi IELTS Writing Task 1 ngày 21/05/2020
The charts show the info about the use of Internet in five countries in Europe in 2000.

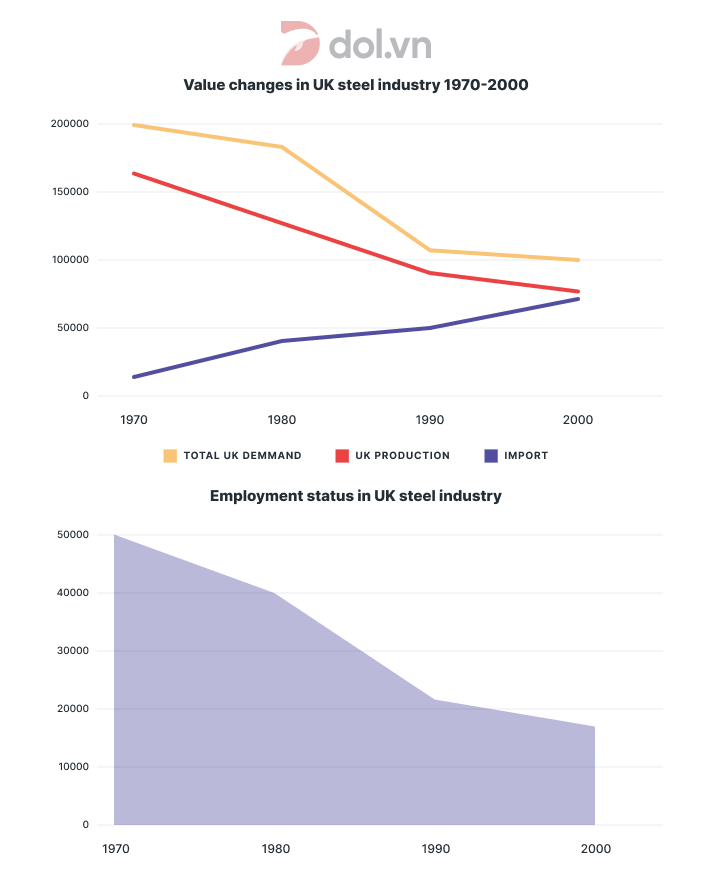
✏️ Đề thi IELTS Writing Task 1 ngày 16/05/2020
The graphs show the changes in the UK industry steel between 1970 and 2000. (đơn vị milliontonnes vs thousand)
✏️ Đề thi IELTS Writing Task 1 ngày 21/03/2020
The diagram below shows how to recycle organic waste to produce fertiliser (compost).

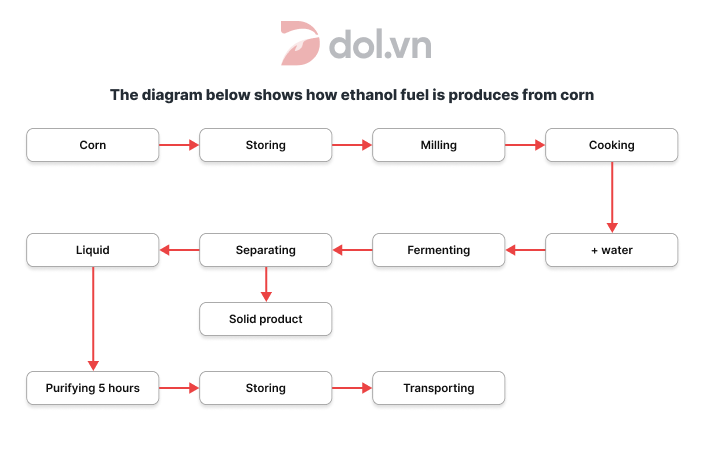
✏️ Đề IELTS Writing Task 1 ngày 18/01/2020
The diagram below shows how ethanol fuel is produced from corn.
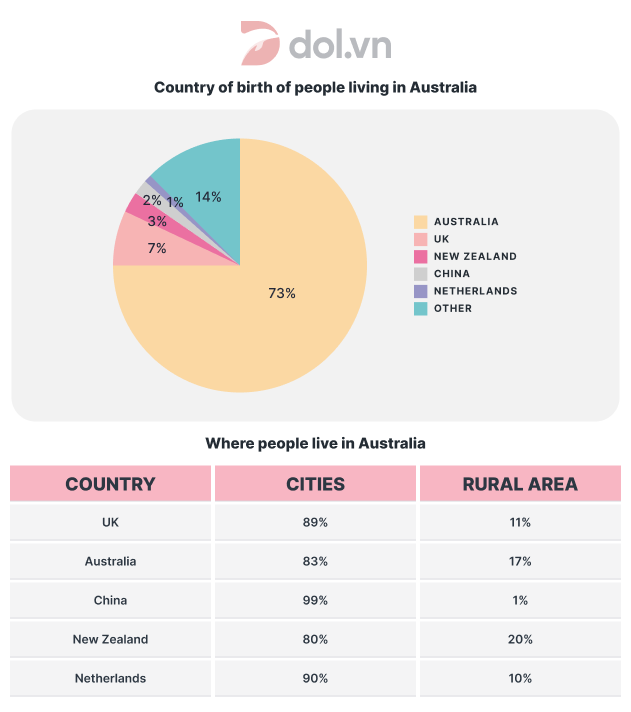
✏️ Đề thi IELTS Writing Task 2 ngày 30/11/2019
The pie chart gives information about the country of birth of people living in Australia and the table shows where people born in these countries live.
✏️ Đề thi IELTS Writing Task 1 ngày 10/10/2019
The charts give information about world forest in six different regions.

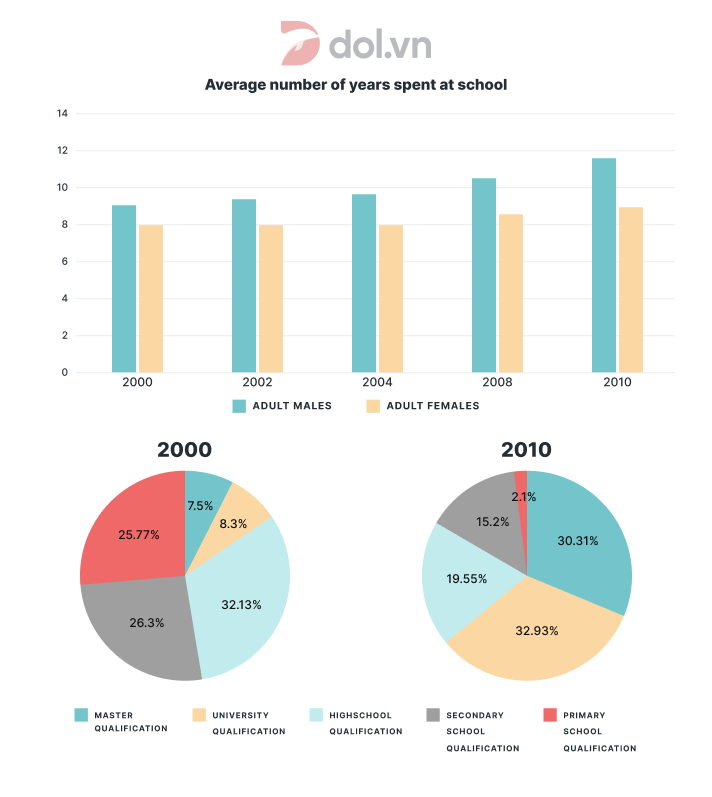
✏️ Đề IELTS Writing Task 1 ngày 02/02/2019
The charts show average levels of participation in education and the highest education level of adults from 2000 to 2010 in Singapore.
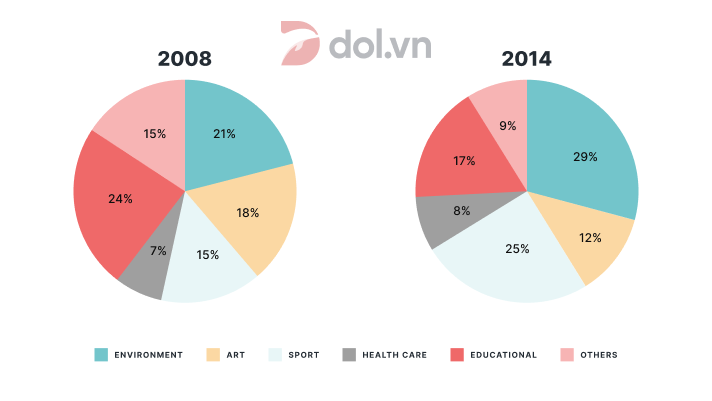
✏️ Đề thi IELTS Writing Task 1 ngày 19/01/2019
The charts below show the percentage of volunteers by organizations in 2008 and 2014.
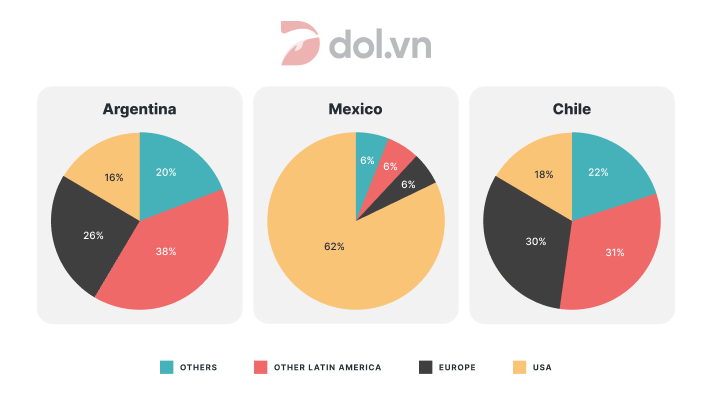
✏️ Đề thi IELTS Writing Task 1 ngày 15/09/2018
The pie charts show the destination of export goods in three countries in 2010.
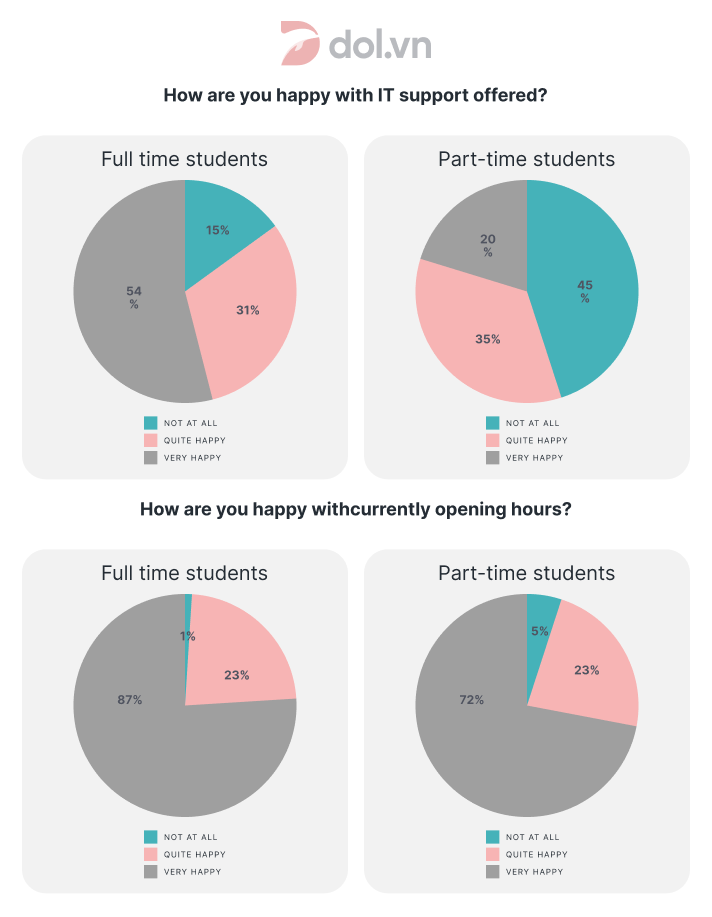
✏️ Đề IELTS Writing Task 1 ngày 10/02/2018
The pie charts show the results of a survey conducted by a university on the opinions of full-time and part-time students about its services.
Bài viết này đã tổng hợp 50 đề thi IELTS Writing Task 1 - Kèm bài mẫu cho tất cả các dạng gồm Bar chart, Pie chart, Line graph, Table, Map, Process, Mixed mới nhất. Hy vọng đây sẽ là nguồn tài liệu tham khảo hữu ích cho những bạn đang ôn thi IELTS. Nếu muốn tìm hiểu thêm về cách làm các dạng bài IELTS Writing Task 1 các bạn có thể tham khảo thêm nhé!
Bài viết khác
Các linking words trong Writing Task 2 là nhóm từ và cụm từ giúp bài essay liên kết chặt chẽ hơn về mặt ý tưởng, từ đó cải thiện độ mạch lạc và khả năng theo dõi lập luận. Tuy nhiên, nhiều người học vẫn gặp khó khăn vì biết khá nhiều từ nối nhưng chưa rõ khi nào nên dùng, dùng ở đâu và dùng như thế nào để câu văn giữ được sự tự nhiên trong bối cảnh IELTS Writing Task 2. Bài viết này của DOL sẽ tổng hợp các linking words trong Writing Task 2 theo từng chức năng nổi bật như sắp xếp trình tự ý tưởng, so sánh, bổ sung thông tin, chỉ nguyên nhân - kết quả, đối lập, đưa ví dụ,... Bên cạnh phần bảng tra cứu, bài viết cũng sẽ làm rõ cách dùng từ nối trong từng phần của bài essay, những lỗi phổ biến khiến bài viết thiếu tự nhiên và một số mẹo giúp người học sử dụng từ nối chính xác hơn. Hãy cùng DOL tìm hiểu ngay nhé!

Muốn tăng IELTS Writing từ 6.0 lên 7.0 cần cải thiện gì? Đây là câu hỏi rất nhiều bạn gặp phải sau khi đã ôn khá lâu nhưng điểm Writing vẫn dừng ở mức 6.0. Trên thực tế, khoảng cách từ band 6 lên band 7 không quá lớn về mặt lý thuyết, nhưng lại khá rõ ở mức độ kiểm soát bài viết, độ chính xác và khả năng phát triển ý theo đúng tiêu chí chấm. Nhiều bài ở band 6 đã trả lời đúng đề, có bố cục tương đối rõ và có sử dụng cả từ vựng nâng cao lẫn câu phức. Tuy nhiên, bài viết vẫn thiếu một vài điểm then chốt để chạm band 7, như overview chưa đủ rõ ở Task 1, lập luận chưa đủ sâu ở Task 2, hoặc từ vựng và ngữ pháp chưa ổn định. Trong bài viết này, DOL sẽ cùng bạn nhìn rõ sự khác biệt giữa hai band điểm, những điểm còn thiếu khiến bài viết chưa lên được band 7, và lộ trình ôn luyện phù hợp để cải thiện hiệu quả.

Signpost words trong IELTS Writing là các từ hoặc cụm từ chỉ dẫn giúp định hướng người đọc, báo hiệu nội dung sắp tới và làm rõ mạch triển khai của bài viết. Khi dùng đúng, signposting language giúp bài viết có bố cục rõ ràng, dễ theo dõi và phù hợp hơn với tiêu chí Coherence and Cohesion trong bài thi viết. Tuy nhiên, nhiều bạn vẫn dùng signpost words theo kiểu liệt kê máy móc, lặp lại hoặc chọn cụm từ chưa phù hợp với văn phong học thuật. Trong bài viết này, DOL sẽ giúp bạn hiểu rõ signpost words là gì, vì sao chúng quan trọng, các nhóm signposting language phổ biến, cách dùng hiệu quả và ví dụ áp dụng trong từng phần của IELTS Writing Task 2.

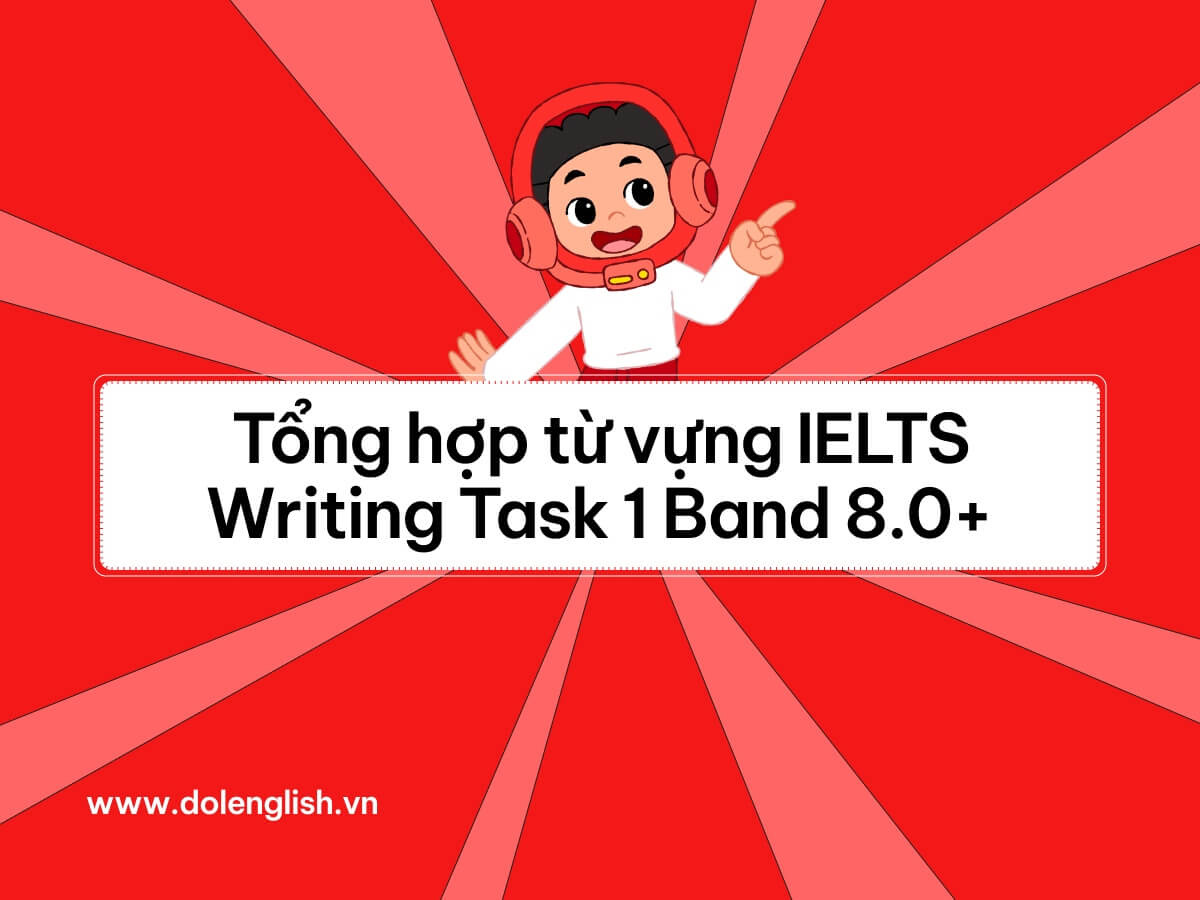
Bạn có thể viết đúng ngữ pháp, mô tả số liệu rõ ràng, nhưng để chạm mốc Band 8.0+ trong IELTS Writing Task 1, thứ bạn cần hơn cả là vốn từ vựng chuẩn – học thuật – đúng dạng bài để đáp ứng tiêu chí Lexical Resource. Tin vui là bạn không phải ghi nhớ hàng trăm từ rời rạc. Chỉ cần nắm đúng những nhóm từ trọng tâm được chọn lọc dưới đây, bài viết của bạn sẽ lập tức trở nên mạch lạc, chính xác và “chất” hơn hẳn. Trong bài viết này, bạn sẽ tìm thấy bộ từ vựng Task 1 đầy đủ nhất theo từng dạng biểu đồ, Map và Process, kèm theo các lưu ý quan trọng để tránh lỗi mất điểm. Tất cả đều được tổng hợp từ tiêu chí giám khảo và bài viết Band 8.0+. 💡 Và nếu bạn muốn lưu lại để học cực nhanh – cực tiện, đừng quên tải file PDF tổng hợp ở cuối bài.
So với Task 1, bài viết ở Task 2 yêu cầu paraphrase phức tạp hơn vì bao gồm nhiều cấu trúc trừu tượng, các khái niệm xã hội – giáo dục – chính sách… Do đó, việc trau dồi hệ thống từ đồng nghĩa (synonyms) theo chủ đề hoặc theo chức năng lập luận là điều cần thiết nếu bạn muốn cải thiện khả năng paraphrase và nâng band từ 6.0 lên 7.5+. Trong bài viết này, DOL sẽ giới thiệu bộ từ đồng nghĩa được chọn lọc theo hướng học thuật, chia theo chủ đề phổ biến và chức năng diễn đạt trong bài luận, kèm theo lưu ý quan trọng và chiến lược học hiệu quả – giúp bạn sử dụng từ ngữ linh hoạt và chính xác hơn trong mọi dạng bài Task 2.
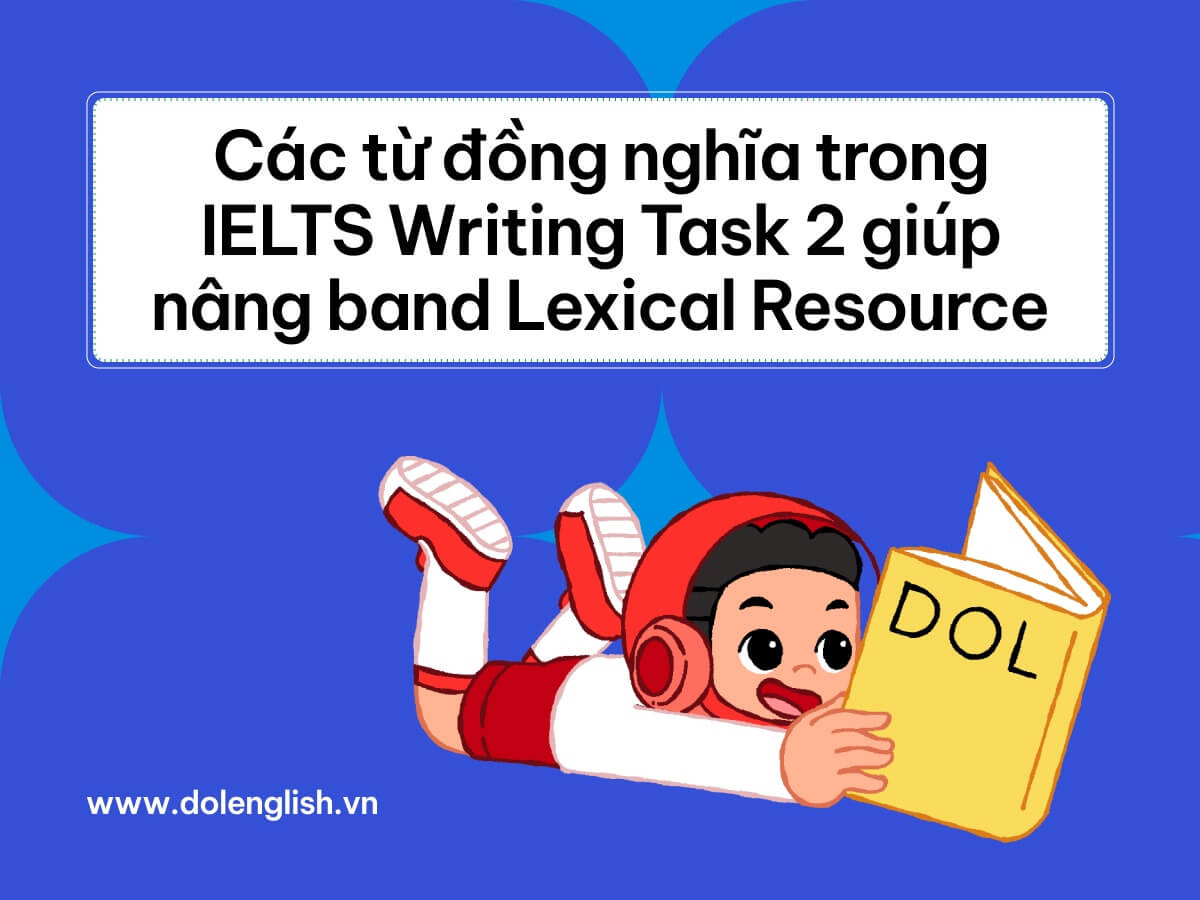
Table of content
✏️ Đề thi IELTS Writing Task 1 ngày 29/05/2021
✏️ Đề thi IELTS Writing Task 1 ngày 22/05/2021
✏️ Đề thi IELTS Writing Task 1 ngày 15/05/2021
✏️ Đề thi IELTS Writing Task 1 ngày 08/05/2021
✏️ Đề thi IELTS Writing Task 1 ngày 29/04/2021
✏️ Đề thi IELTS Writing Task 1 ngày 24/04/2021
✏️ Đề thi IELTS Writing Task 1 ngày 17/04/2021
✏️ Đề thi IELTS Writing Task 1 ngày 10/04/2021
✏️ Đề thi IELTS Writing Task 1 ngày 27/03/2021
✏️ Đề thi IELTS Writing Task 1 ngày 20/03/2021
✏️ Đề thi IELTS Writing Task 1 ngày 13/03/2021
✏️ Đề thi IELTS Writing Task 1 ngày 27/02/2021
✏️ Đề thi IELTS Writing Task 1 ngày 25/02/2021
✏️ Đề thi IELTS Writing Task 1 ngày 20/02/2021
✏️ Đề thi IELTS Writing Task 1 ngày 06/02/2021
✏️ Đề thi IELTS Writing Task 1 ngày 23/01/2021
✏️ Đề thi IELTS Writing Task 1 ngày 21/01/2021
✏️ Đề thi IELTS Writing Task 1 ngày 16/01/2021
✏️ Đề thi IELTS Writing Task 1 ngày 09/01/2021
✏️ Đề thi IELTS Writing Task 1 ngày 19/12/2020
✏️ Đề thi IELTS Writing Task 1 ngày 05/12/2020
✏️ Đề thi IELTS Writing Task 1 ngày 24/10/2020
✏️ Đề thi IELTS Writing Task 1 ngày 31/10/2020
✏️ Đề thi IELTS Writing Task 1 ngày 15/10/2020
✏️ Đề thi IELTS Writing Task 1 ngày 10/10/2020
✏️ Đề thi IELTS Writing Task 1 ngày 17/09/2020
✏️ Đề thi IELTS Writing Task 1 ngày 12/09/2020
✏️ Đề thi IELTS Writing Task 1 ngày 05/09/2020
✏️ Đề thi IELTS Writing Task 1 ngày 22/08/2020
✏️ Đề thi IELTS Writing Task 1 ngày 23/07/2020
✏️ Đề thi IELTS Writing Task 1 ngày 11/07/2020
✏️ Đề thi IELTS Writing Task 1 ngày 09/07/2020
✏️ Đề thi IELTS Writing Task 1 ngày 02/07/2020
✏️ Đề thi IELTS Writing Task 1 ngày 20/06/2020
✏️ Đề thi IELTS Writing Task 1 ngày 13/06/2020
✏️ Đề thi IELTS Writing Task 1 ngày 06/06/2020
✏️ Đề thi IELTS Writing Task 1 ngày 28/05/2020
✏️ Đề thi IELTS Writing Task 1 ngày 25/05/2020
✏️ Đề thi IELTS Writing Task 1 ngày 21/05/2020
✏️ Đề thi IELTS Writing Task 1 ngày 16/05/2020
✏️ Đề thi IELTS Writing Task 1 ngày 21/03/2020
✏️ Đề thi IELTS Writing Task 1 ngày 18/01/2020
✏️ Đề thi IELTS Writing Task 2 ngày 30/11/2019
✏️ Đề thi IELTS Writing Task 1 ngày 10/10/2019
✏️ Đề thi IELTS Writing Task 1 ngày 02/02/2019
✏️ Đề thi IELTS Writing Task 1 ngày 19/01/2019
✏️ Đề thi IELTS Writing Task 1 ngày 15/09/2018
✏️ Đề thi IELTS Writing Task 1 ngày 10/02/2018